The Current View
Growth in demand for raw materials peaked in late 2010. Since then, supply growth has continued to outstrip demand leading to inventory rebuilding or spare production capacity. With the risk of shortages greatly reduced, prices have lost their risk premia and are tending toward marginal production costs to rebalance markets.
To move to the next phase of the cycle, an acceleration in global output growth will be required to boost raw material demand by enough to stabilise metal inventories or utilise excess capacity.
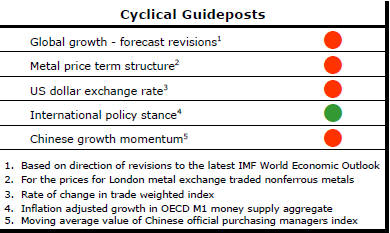
The PortfolioDirect cyclical
guideposts suggest that the best possible macroeconomic circumstances for
the resources sector will involve a sequence of upward revisions to
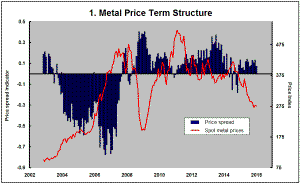
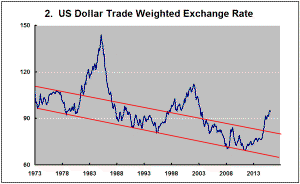
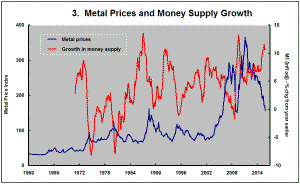
global growth forecasts, the term structure of metal prices once again
reflecting rising near term shortages, a weakening US dollar, strong money
supply growth rates and positive Chinese growth momentum. Only one of
the five guideposts is "set to green" suggesting the sector remains confined
to the bottom of the cycle .
Has Anything Changed?
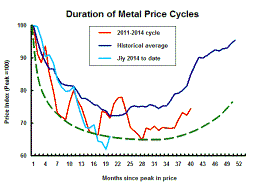
Throughout 2014, PortfolioDirect had been characterising the cyclical position as ’Trough Entry’ with some expectation that by the end of 2014 an exit would be evident. Until very late in the year, the evidence supported that possibility before conditions took several backward steps.
The absence of a growth acceleration among the major economic regions is contributing to the flagging momentum. A stronger US dollar is also imparting a downward bias to US dollar denominated prices presently.
This change has been enough to define a fresh cycle and a more prolonged adjustment process.
Uncertainty Being Blamed for Predictable
Outcomes
The words ‘uncertainty’ and ‘volatility’ are being applied almost
instinctively, sometimes to save embarrassment or create an excuse, even
where ‘highly likely’ and ‘predictable’ are more apt descriptions for
financial and economic outcomes.
Metal prices are constantly referred to as volatile. That runs against what should be happening at this point in the cycle.
Consistent with that expectation and contrary to the common description of market conditions, metal price volatility is nearly as low as it has been at any time in the past 35 years. This contrary view can be justified from many perspectives but one can calculate quite easily the standard deviation in monthly returns in individual metal prices or an index such as the International Monetary Fund metal price index As shown in the chart below), for example, to illustrate the point.
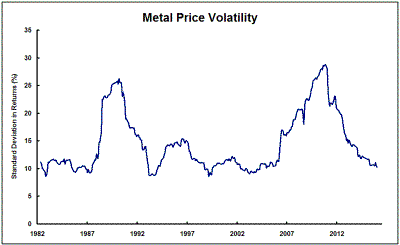
Less volatility in prices should be expected. Prices gravitate toward marginal costs once the typically unusual conditions supporting super-normal profits disappear. Once there, in the trough of the cycle, volatility falls.
At the same time, the behaviour of prices is largely consistent with past responses to market imbalances. There is little aberrant behaviour in the way prices are reacting. Uncertainty would arise more surely if the direction of markets was outside historical norms or prices were reacting perversely based on the theoretical constructs typically used to model markets. But that is not the case.
Global steel production is reported to have fallen in 2015 by 2.9%. Copper usage appears to have dropped by less than 1%. Zinc demand looks like having risen by slightly over 1%. These movements imply cyclically weaker conditions but nothing extreme by historical standards.
Statistical modelling of metal demand growth shows no break in the relationship with global growth over more than 20 years. Conditions are neither unusually volatile nor particularly uncertain. They are proving to be highly predictable even if depressingly uncomfortable.
European GDP Growth Stability
For a resource sector strategist, the search is always on for signs of an
up-tick in global growth. Without that there would be no progression in
commodity price cycles.
The latest survey of professional forecasters conducted by the European Central Bank raises the prospect of little or no growth upside in the European region for the foreseeable future.
The 57 respondents to the quarterly survey conducted in early January showed no sign of budging from their previously expressed expectation of a 1.7-1.8% growth rate over 2016 and 2017. They also thought growth would stick around 1.7% over the remainder of the decade.
The expected European growth profile is the opposite of the ‘uncertainty’ and ‘volatility’ dominating descriptions proffered by commentators about current economic and financial conditions. ‘Steady as she goes’ appears a more apt description.
A less variable growth environment reduces the likelihood of the mining industry being caught by a surprise surge in demand. That, in turn, makes for less volatile prices.
BHP Billiton Finds an Excuse
Another example of the way the words 'uncertainty' and 'volatility' are
abused came as BHP Billiton released its half yearly financial report in the
past few days.
Among the key themes in which the company wrapped its results were “global economic uncertainty” and “volatility to persist”.
Some uncertainty is always present to greater or lesser degrees in financial markets. It is in their nature to have a range of feasible outcomes at any time. With potentially millions of traders taking differing positions based on their respective interpretations of events, an onlooker would be hard pressed to express certainty. BHP is trying to extrapolate these financial market uncertainties to ease the critique of its own circumstances.
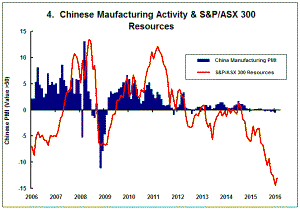
Much of the BHP discussion about ‘uncertainty’ revolves around China where, as it happens, the range of economic outcomes is unusually well defined. The upside risks and uncertainties are minimal. No-one - private forecaster or official - seriously expects GDP growth there to exceed 7%. There is a high probability that growth will, in the very near term, sit at 6-7% before moving lower as the economy comes to depend more heavily on consumption spending and less on investment. This is the aim of the government and consistent with the profile of a large maturing economy. It is highly likely.
The temptation to embrace terms like ‘uncertainty’ and ‘volatility’ rises when the outlook is less favourable than people would prefer to see. Lower or falling prices are deemed volatile. Financial losses are almost always blamed on uncertainty. In contrast, rapidly rising prices or prices supporting high profits are rarely termed volatile. The profit outlook is hardly ever described as uncertain when financial outcomes are unusually strong. Unexpectedly large profits are almost always attributed to superior operational and strategic skills.
As a matter of logic, uncertainty is minimised when a company understands the environment in which it is doing business. BHP’s market analysis has proved inaccurate. It, along with other large corporates and trading groups with interests in China’s ongoing expansion, were forecasting unsustainably strong raw material growth rates even after China had flagged its intention to cut back investment spending.
‘Global economic uncertainty’ can easily become a euphemism for “we got it hopelessly wrong” in an effort to veil embarrassment.
No doubt, conditions are proving unremittingly tough for large swathes of the mining industry. Many are facing deep-seated financial hardship but the industry is prone to exaggerate the uncertainty and volatility it confronts on a well worn cyclical path with ample historical precedent.
This is more than nitpicking over semantics. The language being used increasingly to describe conditions shows a failure, or possible unwillingness, to understand the industry’s true predicament which puts it at risk of failing to respond most effectively to the prevailing conditions.