The Current View
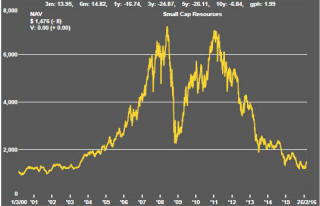
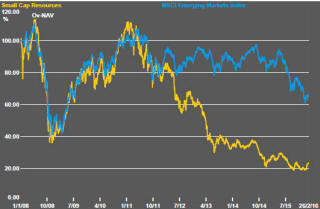
A lengthy downtrend in sector prices had given way to a relatively stable trajectory after mid 2013 similar to that experienced in the latter part of the 1990s and first few years of the 2000s.
The late 1990s and early 2000s was a period of macroeconomic upheaval during which time sector pricing nonetheless proved relatively stable. That remains a possible scenario for sector prices.
Relative stability suggests a chance for companies genuinely adding value through development success to see their share prices move higher. This was the experience in the late 1990s and early 2000s.
The lower equity prices fall - and the higher the cost of capital faced by development companies - the harder it becomes to justify project investments. The market is now entering a period prone to even greater disappointment about project delivery .
Has Anything Changed?
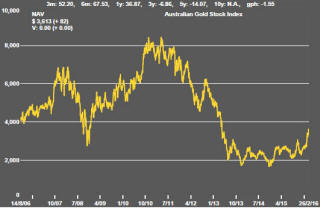
The assumption that June 2013 had been the cyclical trough for the market was premature.
Sector prices have adjusted to the next level of support. The parallel with the 1990s illustrated in Chart 4 is being tested. Prices will have to stabilise around current levels for several months for the thesis to hold.
Key Outcomes in the Past Week
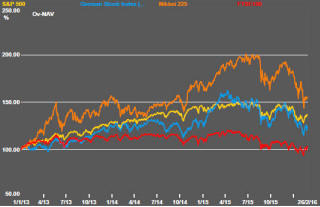
The S&P 500 rose a further 1.6% after the previous week’s strong recovery but stalled around the 1950 mark with the same range of uncertainties moving markets.
Oil prices were once again among the prime market influences. The timing and direction of movements in the WTI crude oil price indicator have coincided closely with movements in the S&P 500 stock index for the past four months. WTI prices rose 10.5% over the week in support of a higher market.
Speculation about a freeze in OPEC oil production raised some hope of an improved market balance. At the end of the week, an agreement appeared elusive despite the Nigerian oil minister and former OPEC president putting the chances of an agreement as “very high” with a prospect of $45-50 prices by the end of 2016.
Others appeared less sanguine with some prominent forecasters now expecting prices to fall below $20/bbl. The more pessimistic forecasters are placing more weight on the potential impact on market balances of the geopolitical tussle between Saudi Arabia and Iran. The Saudis appear reluctant to give up market share in favour of the bid for sales by Iran after termination of economic sanctions.
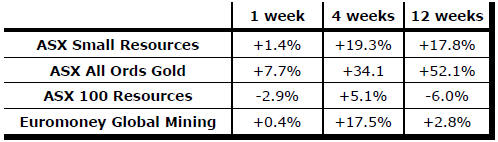
Growth oriented market sectors continued to benefit from higher oil prices and related inferences about global growth prospects. The S&P Dow Jones global basic materials share price index rose 5.1% for the month to date, the largest gain among the 10 sector indicators. Industrial company share prices, with a gain of 1.8%, was the next largest. The average change across the remaining eight sectors was -0.7%.
Slightly stronger U.S. labor market and capital spending
statistics also helped support market conditions.
Jobless claims for the four weeks ended 20 February fell to the lowest level since mid December 2015. A widely followed proxy for business capital spending - new orders of nondefence capital goods excluding aircraft - rose 3.9% in January. This was the largest increase since June 2014 although the rise needs to be placed in the context of a 3.7% decline in the prior month.
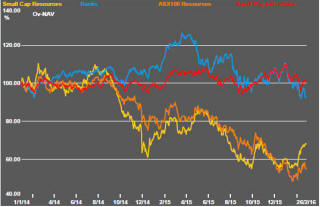
Earlier PortfolioDirect reports had used both these measures as guideposts to U.S. equity market conditions. The previously used charts have been updated here.
The fall in the number of jobless claims (shown in the blue line on the inverse right hand axis of the first of the two charts) suggests continuing support for equity prices. The new orders data, on the other hand, is more indicative of the market top that is clearly evident.
 These
two pieces of information are also further evidence of a divergence in
economic performance between the household and business sectors. While the
two are connected and ultimately cannot remain isolated from one another,
the key U.S. business indicators are far less robust than the main household
performance indicators based on the recent flow of statistics.
These
two pieces of information are also further evidence of a divergence in
economic performance between the household and business sectors. While the
two are connected and ultimately cannot remain isolated from one another,
the key U.S. business indicators are far less robust than the main household
performance indicators based on the recent flow of statistics.
This divergence is consistent with the commentary on business sales in the PortfolioDirect report last week. It highlights why the market appears to be underperforming the economic outcomes. .
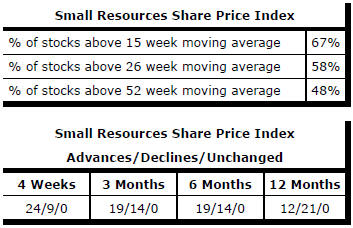
Market Breadth Statistics