The Current View
Growth in demand for raw materials peaked in late 2010. Since then, supply growth has generally outstripped demand leading to inventory rebuilding or spare production capacity. With the risk of shortages greatly reduced, prices lost their risk premia and have been tending toward marginal production costs to rebalance markets.
The missing ingredient for a move to the next phase of the cycle is an acceleration in global output growth which boosts raw material demand by enough to stabilise metal inventories or utilise excess capacity.
The PortfolioDirect cyclical
guideposts suggest that the best possible macroeconomic circumstances for
the resources sector will involve a sequence of upward revisions to
global growth forecasts, the term structure of metal prices once again
reflecting rising near term shortages, a weakening US dollar, strong money
supply growth rates and positive Chinese growth momentum. None of the five guideposts is "set to green"
(after the most recent adjustments in December 2016) suggesting the sector remains confined
to near the bottom of the cycle.

Has Anything Changed? - Updated View
From mid 2014, the metal market cyclical position was characterised as ‘Trough Entry’ with all but one of the PortfolioDirect cyclical guideposts - the international policy stance - flashing ‘red’ to indicate the absence of support.
Through February 2016, the first signs of cyclical improvement in nearly two years started to emerge. The metal price term structure reflected some moderate tightening in market conditions and the guidepost indicator was upgraded to ‘amber’ pending confirmation of further movement in this direction.
As of early December 2016, the Chinese growth momentum indicator was also upgraded to amber reflecting some slight improvement in the reading from the manufacturing sector purchasing managers index. Offsetting this benefit, to some extent, the policy stance indicator has been downgraded from green to amber. While monetary conditions remain broadly supportive, the momentum of growth in money supply is slackening while further constraints on fiscal, regulatory and trade regimes become evident.
The End of Cheap Money
A mood swing among central bankers has raised the prospect of an end to a
near decade long era of cheap money.
The U.S. Federal Reserve has put a firm stake in the ground about its intention to tighten policy. In Europe, central bankers are further away from tightening but are talking about “when” rather than “if” or “whether”.
Growth expectations have readjusted. Outcomes which would have been characterised as disappointing before 2008 are now acceptable or even considered surprisingly strong.
The Chinese official manufacturing purchasing managers index for June showed a slight increase in contrast to expectations for something slightly weaker.
The reaction to the Chinese report was consistent with the lowered expectations for Chinese growth.
The fourth chart in the right hand panel illustrates the effect of six consecutive months of expanding activity on resources sector prices after the 2015 slump in market sentiment.
At the same time, the momentum has not been especially
strong and, in any event, far less than prior to 2008.

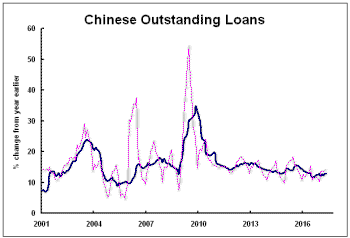
The ongoing growth in the Chinese economy remains dependent on relatively high levels of lending. The growth in loans outstanding has changed little over the last three years as growth in overall output has been declining, suggesting a less positive impact from the financial sector but a still heavy reliance on it for the existing expansion.
A more rapid expansion of activity may be needed to help lift equity values above those levels traded within the past year.
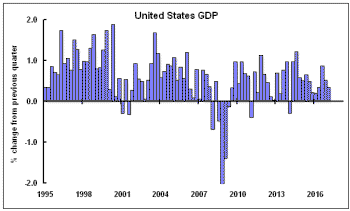
The U.S. Department of Commerce lifted its growth estimate for the March quarter from 0.2% to 0.4%, still the weakest result from the last four quarters. Over the year to the end of March, U.S. GDP is estimated to have grown by 2.1%.
 The
U.S. economy continues its battle to break the 2% growth ceiling which has
persisted for several years and which has now been breached only
unconvincingly.
While the new Trump administration has optimistically forecast growth outcomes rising to 3%, such an improvement is only likely with a significant fiscal stimulus and reduced regulatory constraints on business.
Progress along this path appears less likely after the Republican congressional leadership has shown itself unable to sufficiently corral the disparate philosophical tendencies among its members o allow it to present policies capable of attracting a majority vote.
In its April World Economic Outlook, the International Monetary Fund had raised its U.S. growth forecast in anticipation of new policy measures to support growth. Last week, the IMF announced that it had cut its forecast back to 2.1% in both 2017 and 2018 from 2.3% and 2.5%, respectively, before slowing further to 1.8% by 2020.
By now, U.S. inflation should have been higher, allowing
the Federal Reserve to more aggressively raise interest rates. 
The absence of a stronger inflation response to lower unemployment and a lengthy period of output expansion, albeit moderate, has worried some Federal Reserve governors who may yet hesitate to move as quickly as planned along the tightening path.
At best, the inflation effect might be delayed. At worst, the Fed’s understanding of the economic relationships may need modification evidence of which would throw into doubt the overall stance of policy and raise the possibility of an inadvertent slowdown in growth.
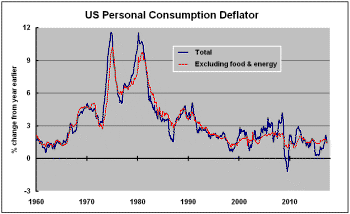
The U.S. personal consumption deflator, the measure most often cited by the Federal Reserve as the targeted inflation indicator, rose by 1.4% over the year to May 2017.
Without the volatile food and energy components, the change in the deflator has remained below the target for a prolonged period.
 European
growth sentiment has improved but, as elsewhere, not by much.
The most recent European Central Bank survey of professional forecasters showed an upgrade in expectations for growth in 2017 and 2018 by 0.2 and a 0.1 percentage points, respectively. That still left expected growth at just 1.6% in 2018 with no improvement foreseen in the years beyond.
There was no change among in forecasters expectations about inflation.
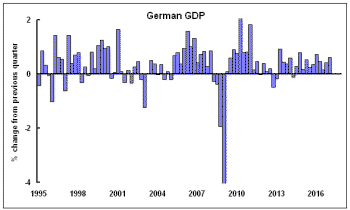
German growth in the first quarter of 2017 was the strongest in a year but still within the range of outcomes over the past four years suggesting insufficient momentum to push annual outcomes significantly above 2% in the most robust of Europe’s national economic regions.


