The Current View
The PortfolioDirect cyclical guideposts suggest that the best possible macroeconomic circumstances for the resources sector will involve a sequence of upward revisions to global growth forecasts, the term structure of metal prices once again reflecting rising near term shortages, a weakening US dollar, strong money supply growth rates and positive Chinese growth momentum.
All of the five guideposts are either "flashing amber" or have turned red suggesting the cycle is struggling to make headway with the risks still tipped toward a continuation of a cyclical downswing..

Has Anything Changed? - Updated View
From mid 2014, the metal market cyclical position was characterised as ‘Trough Entry’ with all but one of the PortfolioDirect cyclical guideposts - the international policy stance - flashing ‘red’ to indicate the absence of support.
Through February 2016, the first signs of cyclical improvement in nearly two years started to emerge. The metal price term structure reflected some moderate tightening in market conditions and the guidepost indicator was upgraded to ‘amber’ pending confirmation of further movement in this direction.
As of early December 2016, the Chinese growth momentum indicator was also upgraded to amber reflecting some slight improvement in the reading from the manufacturing sector purchasing managers index. Offsetting this benefit, to some extent, the policy stance indicator was downgraded from green to amber.
At the end of July 2017, the exchange rate guidepost was upgraded to green.
As 2017 ended, there were emerging signs of economic forecasters beginning a sequence of growth forecast upgrades prompting a revision of the global growth guidepost to "green".
Three quarters of the way through 2018, global growth appears to have peaked and the US dollar is on the rise both warranting guidepost downgrades. The cyclical positioning has been downgraded to 'downswing'.
As 2019 commences, the balance of cyclical forces is more sharply negative. Global growth forecasts are coming down and Chinese growth momentum is facing stronger headwinds.
The early 2020 COVID-19 pandemic has aggravated a tendency to cyclical weakness which had become evident as much as a year earlier.
Cyclical Position
The COVID-19 outbreak is an additional source of downward cyclical pressure which defines the beginnings of a fresh cycle.
The level and direction of metal prices had been consistent with a cyclical downswing dating from February 2018. Very strong rises in nickel prices offset weakness in the prices of other metals during much of 2019, limiting the extent of the weakness in the cyclical price indicator.
To avert further price weakness would have needed some combination of higher global growth than previously anticipated, U.S. dollar weakness or more supportive monetary policies, in any event. The coronavirus outbreak heightens the need for all those factors to move in concert and by a far greater extent than would have been needed to avert further cyclical decline.
Time, of itself, is not important but the sequence of adjustments which are typical of a commodity price cycle and contribute to changed prices and expectations does take time. A more detailed analysis of metal price cyclical duration is available here. The downswing phase of a cycle has an average duration of approximately 20 weeks.
Global Growth - Forecast Revisions
Forecasters had been warning that global economic growth had begun a lengthy stretch on a lower growth trajectory well before the impact on economic activity of the COVID-19 outbreak.
Global
growth accelerated in 2017 from 3.2% to 3.8%, the strongest increase since
the recovery from the financial crisis during 2010. Improving growth
outcomes in the second half of 2017 underpinned rising metal usage following an otherwise lacklustre first half.
The expected synchronised growth which had driven expectations through late 2017 and early 2018 (and which would have been critical to an improvement in mining industry fortunes) dissipated quickly.
The International Monetary Fund confirmed its view, in the October 2018 World Economic Outlook and again in April 2019, that global growth is likely to have reached a peak during the latter part of 2017.
The Fund cut back its 2019 and 2020 growth forecasts in its October 2019 review of the world economy even before taking account of the public health policy reaction to COVID-19 which is now having a severely detrimental impact on economic activity in all major economic regions.
The momentum of economic activity has begun to improve as lockdown measures in the advanced economies and in China have been eased. Ominously, higher rates of infection are becoming evident within a short time after relaxation of the social distancing policies.
Despite the evident improvement in economic outcomes in the second quarter of 2020, the IMF has significantly downgraded its expected 2020 growth rate with all major economic regions now expected to contract.
Substantially lower output levels are expected to be a base for a strong acceleration in the latter part of 2020 leading to unusually high 2021 growth outcomes. Even then, activity may not reach end-2019 levels until 2022.
The improved growth momentum will benefit demand for raw materials with growth in metal usage possibly outstripping outcomes over the past five years.
In the event that the drastic quarantine measures being taken, or foreshadowed, to stall the spread of COVID-19 prove ineffective and the hoped-for decline in the rate of infection in warmer weather does not occur, the growth outlook will prove far worse than anything currently expected, raising the possibility of business failures and a wider financial crisis.
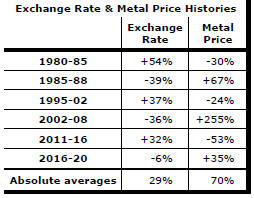
US Dollar Exchange Rate - Chart 2
Over the past 45 years, a 1% fall/rise in the US dollar trade weighted index has come with an average rise/fall of 3% in nonferrous metal prices.
The US dollar has moved lower since mid May 2020 as evidence has mounted that relative interest rates and near term growth performance will not favour the US as much as had been expected. The directional change in the currency has warranted an upgrade from red to amber in the cyclical guidepost.
Along with reduced risks to growth, a weaker
 U.S. dollar
contributed to the upward trajectory in metal prices through 2017. Subsequently,
the stronger dollar reinforced the negative effect on raw material prices of
the weaker growth trajectory.
U.S. dollar
contributed to the upward trajectory in metal prices through 2017. Subsequently,
the stronger dollar reinforced the negative effect on raw material prices of
the weaker growth trajectory.
As evidence of a faltering global economy mounted, greater reliance on the safe haven status of US assets reinforced the upward bias to the US currency.
Relatively strong US bond and equity markets had also attracted investors seeking to hold US dollar denominated assets.
Some of the US dollar
attractiveness appeared to have worn off in the early stages of the market
rout precipitated by the anti-coronavirus measures. The subsequently
dramatic swing
 in
market conditions has been accompanied by strengthening in the currency.
in
market conditions has been accompanied by strengthening in the currency.
Swings in sentiment about the progress being made in stifling the spread of the virus are likely to add volatility to the currency.
Steps taken to counter the COVID-19 are adding to the size of the US government deficit, the size of the government debt and the bond selling task. The US Federal Reserve is taking up some of the increased supply of government securities, in the near term.
In the years ahead, moderate US growth outcomes and rising US debt are likely to push the currency toward its longer term downward trajectory offering medium term support for US dollar denominated commodity prices, including gold. Greater optimism about the overall global growth picture is also likely to take its toll on the currency as capital flows into other countries strengthen.
International Policy Stance - Charts 3&4
Policy, as it impacts the mining industry, emanates most crucially from central banks but government counter-cyclical fiscal policies and structural initiatives designed to enhance productivity outcomes and facilitate the free flow of trade also play important roles.
Global monetary policies had been set after the 2008-09 financial crisis to support higher asset prices as a step toward raising demand and creating stronger employment markets.
Declining growth in US and global money supply attested to subsequently less supportive monetary conditions. In early 2019, US Federal Reserve governors moved their policy guidance from at least three further interest rate increases in 2019 to one or perhaps none. Market forecasters began talking about the chance of the next move in rates being down. The Fed cut its policy rate by 0.25 percentage points in July and again in September.
 The
changed bias in the direction of policy lowered the risk of a dramatic
cyclical slump brought on by excessive tightening in monetary conditions.
The
changed bias in the direction of policy lowered the risk of a dramatic
cyclical slump brought on by excessive tightening in monetary conditions.
The greatest danger to a metal price cycle comes when monetary policy settings begin to tighten in response to higher inflation with an adverse effect on output growth and investment spending.
In previous cycles, authorities have moved to stem monetary growth rates while metal prices have been on the rise, sometimes quite aggressively. The policy tightening has usually ended once metal prices have peaked.
Prior to the onset of COVID-19, the Fed had flagged it was happy with its policy settings, guiding markets to expect little or no change for the foreseeable future. Since January, the Fed has moved its policy rate down 0.5 percentage points and sought to aggressively buy corporate securities to stabilise financial markets and shore up asset prices.
Concerted central bank action has supplemented large increases in government spending to mitigate the effects on economic activity of widespread job losses. While unprecedented, the central bank and government actions will not have fully compensated for the loss of output arising from forced business closures and abandoned private sector investment projects,
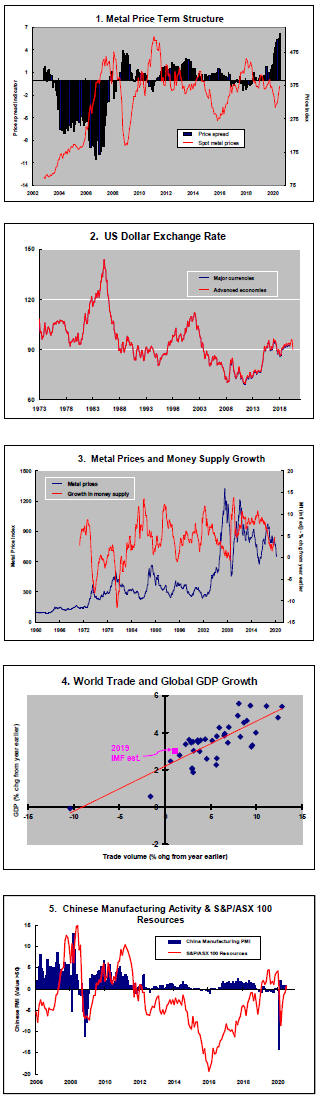
Metal Price Term Structure - Chart 1
The tightening in nonferrous metal forward price spreads evident through 2018 has given way to signs of less market concern about supply availability.
 Despite
historically slow growth in demand for the past several years, inventory
expansion had been limited by weak supply growth
Despite
historically slow growth in demand for the past several years, inventory
expansion had been limited by weak supply growth
The International Copper Study Group (ICSG) has reported that demand for copper in 2019 is on track to contract.
The succession of million tonne-plus increases in annual copper usage during the first decade of the century, requiring new metal making capacity, is not being reproduced.
The International Lead Zinc Study Group has reported that zinc usage has not changed significantly since 2014.
Some part of the constraints on the supply side have been involuntary
insofar as permitting times have blown out and development finance has been hard to
access. Especially  in
the case of zinc, mine closures due to mineral exhaustion have had an
effect.
in
the case of zinc, mine closures due to mineral exhaustion have had an
effect.
Some other production cuts can be reversed in the event demand growth accelerates.
The pipeline of development properties has begun to grow more strongly, leaving markets likely to experience a stronger flow of metal in 2020 and 2021
With a potentially severe near term hit to metal use arising from COVID-19, metal price spreads should widen. Depending on the severity of the usage shortfall, inventory building could occur throughout most of 2020 and for a year or two after without changes to current production intentions.
Chinese Growth Momentum - Chart 5
Chinese growth was destined to head lower in coming years
but China has consistently met annual statistical goals through periodic growth surges
when necessary.

Accepting the accuracy of the data, the government appears to have been able to do just enough to meet its targets. As this becomes progressively harder, Chinese policymakers are being forced to gradually guide expectations lower.
The restructuring of the Chinese economy with a resulting contraction in the contribution to Chinese GDP of investment spending is having a generally detrimental effect on raw material demand.
A 1.4% GDP growth rate in the first quarter of 2019 was the slowest quarterly rise since the first quarter of 2016. That was speeded up in the second quarter to 1.6% for an annualised growth rate of 6.6%.
Signs of subdued Chinese investment momentum have been evident in statistics released by the International Copper Study Group and the International Lead Zinc Study Group which have shown unusually weak growth in metal use over the past several years.
The leverage to monetary and fiscal policy changes has been falling in the absence of market reforms comparable in importance to those which have occurred historically.
China's loss of production in the first half of 2020 will affect the pattern of growth over the next year or two. If output rates revert to normal through the middle of 2020, growth in 2021 could be sharply higher than in 2020 and higher than would have otherwise been the case without the coronavirus impact.