The Current View
Growth in demand for raw materials peaked in late 2010. Since then, supply growth has continued to outstrip demand leading to inventory rebuilding or spare production capacity. With the risk of shortages greatly reduced, prices have lost their risk premia and are tending toward marginal production costs to rebalance markets.
To move to the next phase of the cycle, an acceleration in global output growth will be required to boost raw material demand by enough to stabilise metal inventories or utilise excess capacity.
The PortfolioDirect cyclical
guideposts suggest that the best possible macroeconomic circumstances for
the resources sector will involve a sequence of upward revisions to
global growth forecasts, the term structure of metal prices once again
reflecting rising near term shortages, a weakening US dollar, strong money
supply growth rates and positive Chinese growth momentum. Only one of
the five guideposts is "set to green" suggesting the sector remains confined
to the bottom of the cycle .

Has Anything Changed? - Updated View
Since mid 2014, the metal market cyclical position has been characterised as ‘Trough Entry’ as prices have remained in downtrend with all but one of the PortfolioDirect cyclical guideposts - the international policy stance - flashing ‘red’ to indicate the absence of support.
The absence of a global growth acceleration, a stronger dollar and flagging Chinese growth momentum remain critical features of the current cyclical positioning.
Through February 2016, the first signs of cyclical improvement in nearly two years started to emerge. After 15 months of contango, the metal price term structure shifted to backwardation reflecting some moderate tightening in market conditions.
The metal price term structure is the most sensitive of the five cyclical guideposts to short term conditions and could, consequently, quickly reverse direction. Nonetheless, this is an improvement in market conditions and the guidepost indicator has been upgraded to ‘amber’ pending confirmation of further movement in this direction.
Metal Price Cycle Improves
The cyclical positioning of metal prices has improved over the past month
while remaining consistent with a below average cyclical trough.
The improved pricing environment has coincided with some easing in the U.S. dollar during June although that has been reversed more recently with the UK vote to drop its European Union membership.
Consistent with earlier cycles, some firming in prices can be expected without a clear improvement in underlying demand or a material rundown in inventories.
Within the indices, there are also likely to be ebbs and flows which average out to only modest gains while the cyclical adjustment continues.
While this does not appear a particularly exciting investment environment, it is better than what has gone before. Importantly, too, it does remove a layer of risk within the equity market opening the way for more buoyant equity prices which could outperform the commodity prices to which the companies are exposed.
Car Sales Slowdowm May Be Growth Precursor
News services reported on Friday that U.S. motor vehicle sales were running
at a 16.7 million seasonally adjusted annual rate in June versus 17.5
million in May. The result was slightly disappointing in that some analysts
had been expecting an outcome of 17.0-17.1 million units.
Sales had reached a record rate of 17.5 million units in
2015. The results for the first half of 2016 suggest that the outcome for
the full year will fall short of the prior year result.

While the motor vehicle industry is only a small and diminishing part of the U.S. economy, the importance of the statistics rests on what they say about the cyclical positioning of the economy. The statistics are increasingly consistent with others showing an economy losing momentum.
The recovery in the motor vehicle market pushed along by a prolonged period of employment growth, falling unemployment, cheap funding and relatively inexpensive fuel costs seems to have passed its peak.
From a resource sector viewpoint, the state of the motor vehicle market might also indicate households operating at the edge of their budgets with a greater reluctance to purchase durable goods more generally.
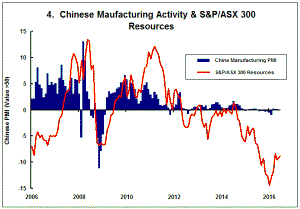
China on the Cusp
China’s manufacturing purchasing managers index continued on the cusp
between contraction and expansion in June. The June result is the twenty
first consecutive month in which the reading has been within one percentage
point of 50. 
The index, one of the five guideposts used in the PortfolioDirect macro analysis to gauge cyclical progress, is shown in the fourth chart in the right hand panel each week.
The chart accompanying the text this week is a close-up version of the longer term picture to show more clearly how the prices of ASX-listed resources companies have been responding to the subdued movements in the purchasing managers’ index over the past two years.
With the Chinese government continuing to emphasise the need for structural adjustment, including closure of the least efficient industrial capacity, growth in Chinese manufacturing output could remain stalled for several more years.