The Big Picture
After recovering through 2010, a lengthy downtrend in sector prices between 2011 and 2015 gave way to a relatively stable trajectory similar to that experienced in the latter part of the 1990s and first few years of the 2000s.

The late 1990s and early 2000s was a period of frequent macroeconomic upheaval during which time sector pricing nonetheless proved relatively stable.
Relative stability in sector prices suggests a chance for individual companies genuinely adding value through development success to see their share prices move higher. This was the experience in the late 1990s and early 2000s.
Still vulnerable cyclical conditions were aggravated in the second half of 2015 by a push from investors worldwide to reduce risk. Sector prices were pushed to a new cyclical low some 90 months after the cyclical peak in sector equity prices but these conditions were reversed through 2016 and 2017 as global growth accelerated although, for the most part, sector prices did little more than revert to 2013 levels which had once been regarded as cyclically weak.
Global growth, having peaked in late 2017, the sector has been in cyclical downswing since early 2018.
With a median decline in prices of ASX-listed resources companies since the beginning of 2011 of 89% (and 30% of companies suffering a decline of more then 95%), the majority of stocks remain prone to strong 'bottom of the cycle' leverage in response to even slight improvements in conditions.
In the absence of a market force equivalent to the industrialisation of China, which precipitated an upward break in prices in the early 2000s, a moderate upward drift in sector equity prices over the medium term is likely to persist.
The Past Week
Earnings results for the September quarter have been sufficiently strong to push US equity markets to record levels. Volatility indicators portray investors as having few concerns about of the market outlook.
US equity prices have once again begun to outstrip stagnant national profits, according to data from the US government national accounts. This pattern was last evident in the late 1990s leading to the 2001 recession. Market gains driven by speculative capital flows connected to technology investments were reversed on that occasion.
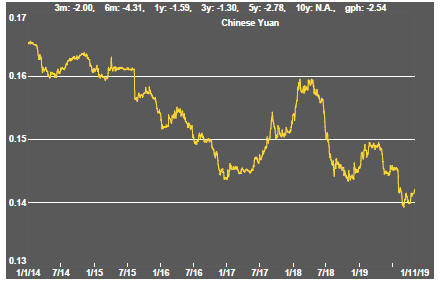
Optimism about the outcome of US-China trade talks has helped buoy equity prices. Chinese officials were reported as saying that the two sides had reached a consensus on outstanding matters (which begs the question of what they had been disagreeing about even as US President Donald Trump was saying that finalising a text for signature by the leaders of the two countries was all that was needed).
As expected, the US Federal Reserve announced that it would cut the Fed Funds rate by another 0.25 percentage points. Rather than foreshadow more easing, the Fed governors positioned the decision as having gone as far as is needed, given the current state of the US economy. Fed chairman Powell characterised risks as having been lowered with an apparent agreement on trade between the US and Chinese governments and a revised withdrawal pact signed between the UK government and European Union leaders.
Powell left open the possibility of further cuts if conditions deteriorated but downplayed expectations of further easing as long as growth remained moderate and inflation continued to edge higher.
Labour market data for October, released at the end of the week, underscored the continuing strength of employment and the buoyant outlook for consumer demand. Weak US manufacturing output and business investment have not had a negative impact, at least so far, on employment. Fed policymakers will be hoping improved global trading conditions boost business investment by enough to sustain the labour market strength.
The US purchasing managers index for October showed that manufacturing output continued to contract but at a lesser rate than in September. The potentially improved momentum was another source of market confidence.
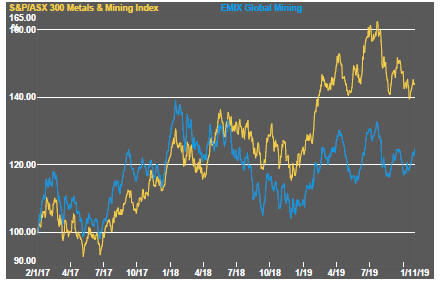
Resource sector equity prices were moderately higher but, in contrast with broader market indicators, remain below early 2018 prices.
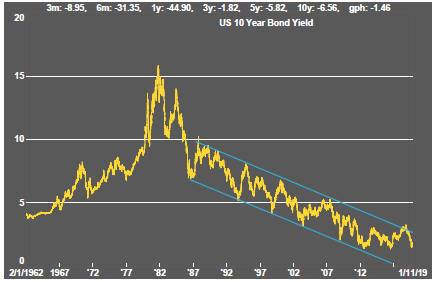
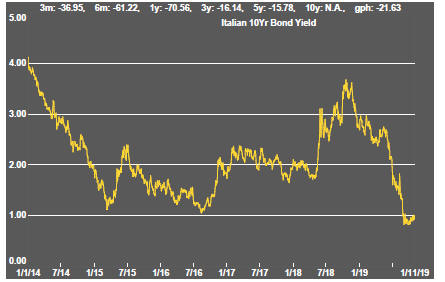
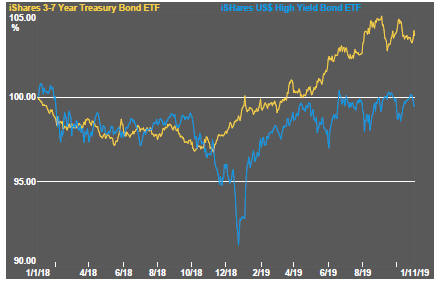
Some weakening in the US dollar suggests a change in the momentum of global economic conditions. Where growth had been worsening, the rate of deterioration has declined. Changing growth momentum will have contributed to the recent upward bias in government bond yields.
The Australian dollar is among the currencies to show signs of appreciation against the US dollar.
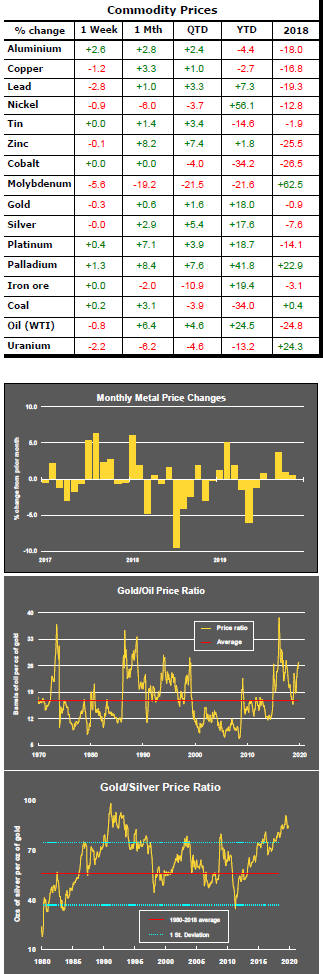
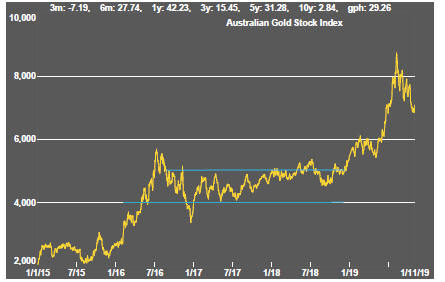
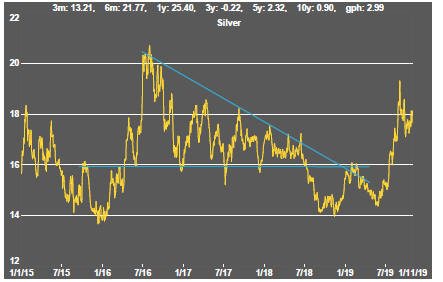
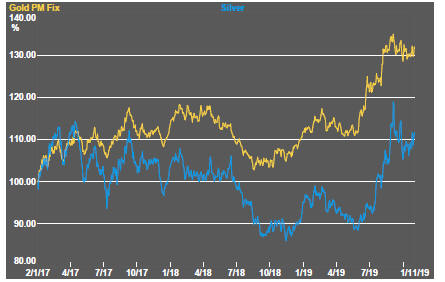
The upward bias in interest rates has kept downward pressure on gold prices which have been treading water around the $1,500/oz mark as financial markets adjust to changing conditions.
Although the silver price has tracked in a similar way to gold, palladium prices have maintained their dramatic ascent. Their outperformance against platinum, as well as gold and silver, has highlighted the market pressures facing pollution control manufacturers looking to secure adequate supplies.
Industrial metal prices edged lower but without strong conviction. The copper price has moved little during 2019 suggesting little change in the course of economic growth during the year.
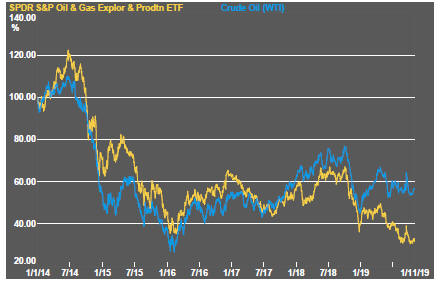
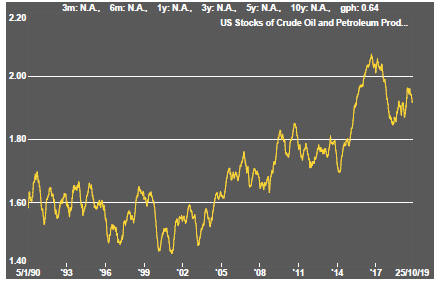
Crude oil prices moved slightly lower although they remain significantly higher over the course of 2019, in contrast to the path of the related equity prices which have heavily discounted any improvement in market outlook for crude demand or prices.
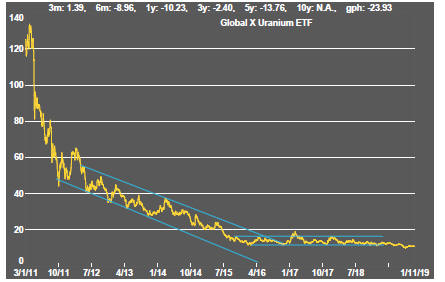
The uranium and battery metal segments have not shown significant signs of improved investor interest despite the generally bullish expectations for demand in the longer term.
Sector Price Outcomes


52 Week Price Ranges

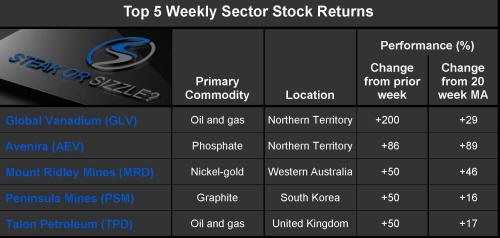
The Steak or Sizzle? blog LINK contains additional commentary on the best performed stocks in the sector and the extent to which their investment outcomes are underpinned by a strong enough value proposition to sustain the gains.
Equity Market Conditions


Resource Sector Equities


Interest Rates


Exchange Rates


Commodity Prices Trends

Gold & Precious Metals


Nonferrous Metals


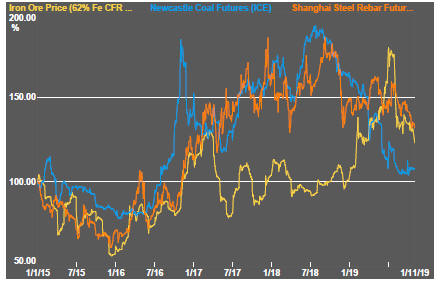
Bulk Commodities

Oil and Gas

Battery Metals


Uranium