The Current View
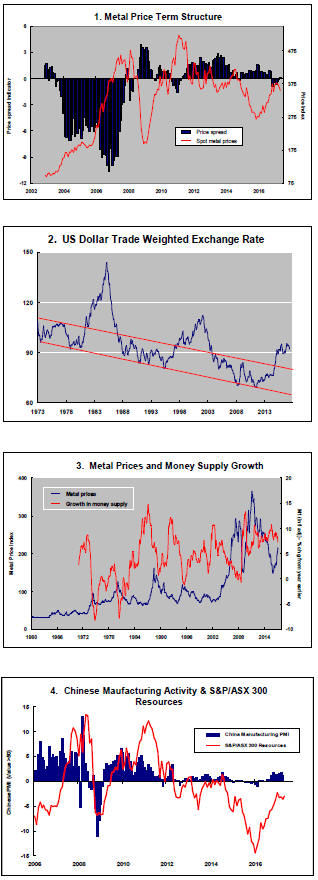
Growth in demand for raw materials peaked in late 2010. Since then, supply growth has generally outstripped demand leading to inventory rebuilding or spare production capacity. With the risk of shortages greatly reduced, prices lost their risk premia and have been tending toward marginal production costs to rebalance markets.
The missing ingredient for a move to the next phase of the cycle is an acceleration in global output growth which boosts raw material demand by enough to stabilise metal inventories or utilise excess capacity.
The PortfolioDirect cyclical
guideposts suggest that the best possible macroeconomic circumstances for
the resources sector will involve a sequence of upward revisions to
global growth forecasts, the term structure of metal prices once again
reflecting rising near term shortages, a weakening US dollar, strong money
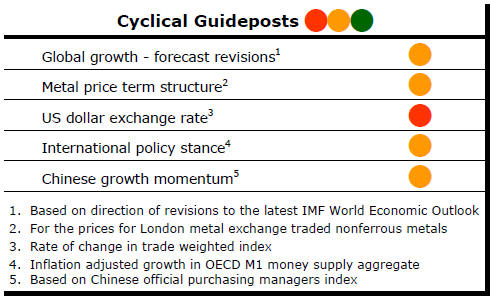
supply growth rates and positive Chinese growth momentum. None of the five guideposts is "set to green"
(after the most recent adjustments in December 2016) suggesting the sector remains confined
to near the bottom of the cycle.
Has Anything Changed? - Updated View
From mid 2014, the metal market cyclical position was characterised as ‘Trough Entry’ with all but one of the PortfolioDirect cyclical guideposts - the international policy stance - flashing ‘red’ to indicate the absence of support.
Through February 2016, the first signs of cyclical improvement in nearly two years started to emerge. The metal price term structure reflected some moderate tightening in market conditions and the guidepost indicator was upgraded to ‘amber’ pending confirmation of further movement in this direction.
As of early December 2016, the Chinese growth momentum indicator was also upgraded to amber reflecting some slight improvement in the reading from the manufacturing sector purchasing managers index. Offsetting this benefit, to some extent, the policy stance indicator has been downgraded from green to amber. While monetary conditions remain broadly supportive, the momentum of growth in money supply is slackening while further constraints on fiscal, regulatory and trade regimes become evident.
Metal Price Forecast Optimism
The global mining industry is entering a prolonged period of more
comfortable conditions if worldwide commodity price forecasts are any guide.
The International Monetary Fund (IMF) is forecasting
that prices of all the principal base metals will be indefinitely higher
than in 2016, as is the World Bank.

The only exception to the rising commodity price trend is for iron ore which both global institutions expect to fall below the average price prevailing in 2016 after rising temporarily in 2017.
The IMF expects iron ore prices to fall in 2018 (but stay above current levels) before dropping again in 2019 to a sustainable price in the US$50-55/tonne range.
The World Bank expects iron ore prices to average $65/tonne in 2017 but then sit in the same range for a prolonged number of years. By 2030, the World Bank expects the final price to have recovered somewhat to US$60/tonne.
The other area of relative weakness, according to the IMF, is uranium. The Fund has forecast prices which averaged US$26/lb in 2016 to remain in a US$23-26/lb range for the next six years.
The IMF expects a sustained lift in the prices of the
principal non-ferrous metals in 2017. By 2022, aluminium, copper and nickel
prices will be 22-29% higher than they were in 2016. Tin and zinc prices are
expected to be 3-5% higher.

The World Bank has a similar view. Aluminium, copper and zinc prices will be among the strongest (up 21-40%) from 2016. The Bank expects tin and zinc (up 18-21%) to fare better than forecast by the IMF.
Expectations in the two big international institutions are not much different to those among the broader forecasting community.
According to S&P Global Market Intelligence, the consensus among forecasters is for iron ore prices to track slightly lower over the coming three years but remain only slightly below US$60/tonne.
The S&P consensus estimates show aluminium, copper, tin and zinc prices being 18-28% higher. The consensus for the nickel price outlook implies a gain of 42% as does the view about cobalt prices.
The biggest increase according to the S&P consensus estimates is likely to come from uranium with an implied 82% gain over 2016 prices by 2019.
Iron ore aside, the weakest price outcomes are expected to occur among precious metals with the gold price consensus implying a rise of only 4%. The World Bank is forecasting a steady decline in the gold price toward US$1,000/oz by 2030.
The broad explanation for the difference in performance between base metals and precious metals boils down to growth.
To the extent global growth exerts upward pressure on prices, it is also likely to impart upward pressure on interest rates which will affect gold prices adversely.
The World Bank, which also forecasts prices for fertiliser inputs, expects their prices to also display an upward trend. It is forecasting prices in 2016 to have been the nadir in sector outcomes.
The balance of risks to these forecasts comes from the implied outlook for growth underpinning the numbers.
The major international financial organisations are expecting stronger growth in the years ahead than in 2016 but not by a large margin.
The World Bank has kept its global GDP growth forecast below 3% for the upcoming three years.
Among the advanced economies, the Bank does not expect growth to budge significantly from the 1.7% rate struck in 2016.
The Bank’s forecast of strengthening global growth relies on strongly accelerating output gains within emerging market economies. Most notably, the World Bank is expecting improved performances from Russia, Brazil and Turkey which all face considerable political headwinds which could derail any significant improvement.
From an analytical perspective, there is also evidence of circular reasoning. Some of the strongest gains in growth are expected to come from commodity exporting economies. Better commodity returns depend on improved growth outcomes which depend on better commodity returns.
The balance of macro risks for commodity markets has probably fallen but, without an improvement in the momentum of growth, supply increases could continue to outstrip modest demand increments leading to constraints on how much prices can rise and, possibly, even force prices lower if revised expectations dent sentiment too greatly.