The Current View
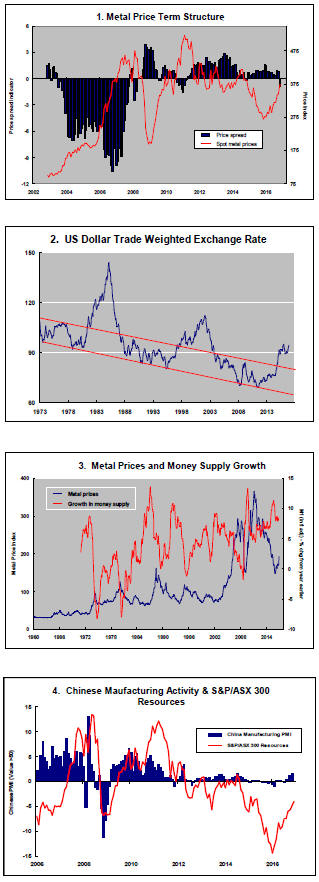
Growth in demand for raw materials peaked in late 2010. Since then, supply growth has generally outstripped demand leading to inventory rebuilding or spare production capacity. With the risk of shortages greatly reduced, prices lost their risk premia and have been tending toward marginal production costs to rebalance markets.
The missing ingredient for a move to the next phase of the cycle is an acceleration in global output growth which boosts raw material demand by enough to stabilise metal inventories or utilise excess capacity.
The PortfolioDirect cyclical
guideposts suggest that the best possible macroeconomic circumstances for
the resources sector will involve a sequence of upward revisions to
global growth forecasts, the term structure of metal prices once again
reflecting rising near term shortages, a weakening US dollar, strong money
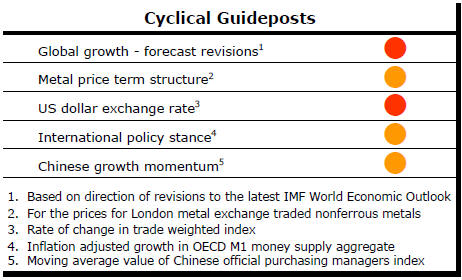
supply growth rates and positive Chinese growth momentum. None of the five guideposts is "set to green"
(after the most recent adjustments in December 2016) suggesting the sector remains confined
to near the bottom of the cycle.
Has Anything Changed? - Updated View
From mid 2014, the metal market cyclical position was characterised as ‘Trough Entry’ with all but one of the PortfolioDirect cyclical guideposts - the international policy stance - flashing ‘red’ to indicate the absence of support.
Through February 2016, the first signs of cyclical improvement in nearly two years started to emerge. The metal price term structure reflected some moderate tightening in market conditions and the guidepost indicator was upgraded to ‘amber’ pending confirmation of further movement in this direction.
As of early December 2016, the Chinese growth momentum indicator was also upgraded to amber reflecting some slight improvement in the reading from the manufacturing sector purchasing managers index. Offsetting this benefit, to some extent, the policy stance indicator has been downgraded from red to amber. While monetary conditions remain broadly supportive, the momentum of growth in money supply is slackening while further constraints on fiscal, regulatory and trade regimes become evident.
Missing Ingredients Retard Mining Cycle
Absence of a global growth acceleration remains the principal retarding
factor in the cyclical make-up of the mining industry.
A genuine cyclical upswing normally comprises four elements:
-
Supply side adjustments, the most directly controllable parts of the cycle, are a relatively early precursor. Their timing and size depend on how long it takes reluctant companies to match their expectations to the surrounding business realities.
-
Next, but possibly overlapping the supply adjustments, demand growth stabilises after the disruption to usage patterns from deteriorating global growth or recession.
-
Then comes the most potent part of the cycle, namely, the growth surprise when industry expectations about how much mine output will be needed are surpassed.
-
Commodity prices are prone to reach their peak when these forces combine with the fourth element, namely, US dollar weakness.
In coming to a judgment about the current cyclical positioning, it is also worth remembering how infrequently these influences are aligned. There have been just nine cycles of any size, some quite modest, in nearly 60 years, on my reckoning.
In the current cycle, parts of the first and second stages have been completed but the third and fourth stages appear as remote as ever.
The macro backdrop to the mining industry has undoubtedly changed for the better over the past 12 months but the prevailing outlook is one of relatively low and unusually stable growth.
Lowered growth volatility making anticipation of raw material needs relatively straightforward is not conducive to a build-up of cyclical pressures.
A year ago, commodity and sector equity prices were still tumbling. By the end of 2015, the median fall in ASX-listed resources stock prices since the beginning of 2011 had reached 89%. A staggering 30% of the stocks trading on the Australian market had suffered losses of more than 95%.
Even these dire numbers understate the intensity of the cyclical deterioration as some companies had simply failed to survive long enough to be counted.
However, uninviting these conditions might have appeared, the scene was set for a strong price response to even modestly improved conditions.
A refreshed global risk appetite through the first half of 2016 which brought improved prices for a wide range of asset classes was the unexpected catalyst to a sector re-pricing.
Bucking forecasters’ predictions, bond prices rose. The iShares US government bond exchange traded fund gained 20%. The Bloomberg high yield global corporate bond index rose 19%. Flows into emerging markets pushed the MSCI emerging market share price index up by as much as 33%.
The Euromoney global mining index added 102% while Australia’s small resources share price index, the broadest available sector guidepost, gained 87%.
Many apparently impressive mining industry gains reflected the intense leverage at the bottom of the cycle to such improved conditions but the 100% return due to a share price move from 5¢ to 10¢ hardly compensated for the original fall from $2.
Despite the potential for bottom of the cycle leverage among small stocks, gains came most easily at the upper end of the market. The median share price improvement through the first half of 2016 over the entire Australian resource universe was a more restrained 21%.
Some commodity prices have shown unexpected strength recently. Coal and iron ore prices, for example, have risen by 75-85% resulting in companies leveraged to these exposures producing some outstanding market returns.
Whitehaven Coal and Atlas Iron, two beneficiaries, have added 300% and 140%, respectively, as their boosted profitability has held out the chance of hugely transformed corporate financial risk profiles.
Metal prices are now, for the first time since 2010, running significantly ahead of the average cyclical position for this far into the cycle although that positioning is only recently evident and sustained for barely a few days.
Not all commodity sectors are showing such life. Uranium-related equity prices have remained in a prolonged downtrend. The Global X uranium exchange traded fund, for example, is 12% lower than at the end of 2015.
Since July, the resources sector has failed to respond as positively as others to the ongoing embrace of risk. With insufficient follow-through buying to replicate the market momentum evident elsewhere, the small resources share price index has changed little over the past five months.
The election of Donald Trump as president of the USA has spurred some to infer an improvement in growth prospects. The capital intensity of US GDP, a critical measure of mining industry support, has been on a cyclically weakening path, within a long term declining trend, since the end of 2014. Many of the new president’s stated policy positions appear more growth oriented than the status quo with an emphasis on infrastructure spending and an expansion of manufacturing output but the road to authorising legislation, let alone real activity, can be slow and circuitous.
A mining-friendly growth outlook would probably also require spin-off benefits to help drive stronger growth in China, Japan, Russia and South America. In too many respects, the reverse is on the cards as a new US policymaking regime asserts its belief that one country’s growth must come at the expense of another.
Just as worryingly for US dollar denominated commodity prices, the rising dollar is now touching levels not seen since 2003. The earlier stages of its rise were conspicuously associated with the cyclical leg down in metal prices between mid-2014 and the end of 2015. More downward pressures loom from the current trajectory of the currency.
The most obvious historical parallel is now with the late 1990s. By then, sector equity prices had stabilised but rises were only slight until China became an unexpectedly potent economic influence in world markets. Presently, there is no successor to China to raise hopes for such a growth fillip.
.