The Current View
Growth in demand for raw materials peaked in late 2010. Since then, supply growth has continued to outstrip demand leading to inventory rebuilding or spare production capacity. With the risk of shortages greatly reduced, prices have lost their risk premia and are tending toward marginal production costs to rebalance markets.
To move to the next phase of the cycle, an acceleration in global output growth will be required to boost raw material demand by enough to stabilise metal inventories or utilise excess capacity.
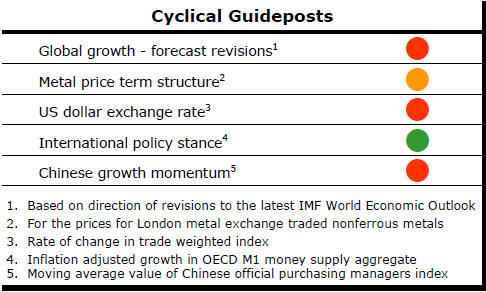
The PortfolioDirect cyclical
guideposts suggest that the best possible macroeconomic circumstances for
the resources sector will involve a sequence of upward revisions to
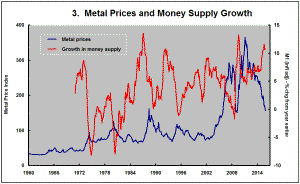
global growth forecasts, the term structure of metal prices once again
reflecting rising near term shortages, a weakening US dollar, strong money
supply growth rates and positive Chinese growth momentum. Only one of
the five guideposts is "set to green" suggesting the sector remains confined
to the bottom of the cycle .
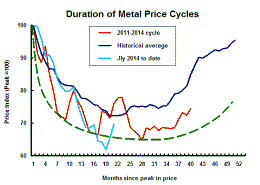
Has Anything Changed? - Updated View
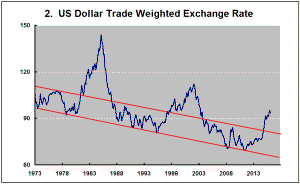
Since mid 2014, the metal market cyclical position has been characterised as ‘Trough Entry’ as prices have remained in downtrend with all but one of the PortfolioDirect cyclical guideposts - the international policy stance - flashing ‘red’ to indicate the absence of support.
The absence of a global growth acceleration, a stronger dollar and flagging Chinese growth momentum remain critical features of the current cyclical positioning.
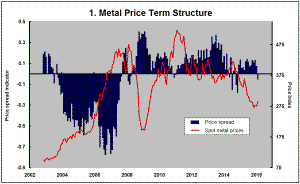
Through February 2016, the first signs of cyclical improvement in nearly two years started to emerge. After 15 months of contango, the metal price term structure shifted to backwardation reflecting some moderate tightening in market conditions.
The metal price term structure is the most sensitive of the five cyclical guideposts to short term conditions and could, consequently, quickly reverse direction. Nonetheless, this is an improvement in market conditions and the guidepost indicator has been upgraded to ‘amber’ pending confirmation of further movement in this direction.
US Job Gains Cut Recession Talk
Job gains of 242,000 in February, reported by the US government on Friday,
helped ease worries about the onset of a US recession. Only a small
minority of forecasters had been courageous enough to overtly declare that a
recession was likely but a good number had hedged their bets by referring to
the probability of recession as having risen. The attribution of the higher
probability did contribute to a lifting in market anxiety.
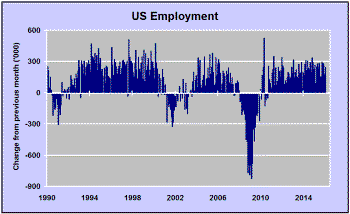 As
well as an increase in February employment, the size of the labour force
(i.e. those working and those looking for work) also swelled suggesting that
a rising number of previously discouraged workers were reassessing the
likelihood of finding a job if they started looking again. This was the
third consecutive month in which the labour force grew more quickly than
employment. If the instincts of the job searching workers are right,
further strong employment gains should be seen in coming months.
As
well as an increase in February employment, the size of the labour force
(i.e. those working and those looking for work) also swelled suggesting that
a rising number of previously discouraged workers were reassessing the
likelihood of finding a job if they started looking again. This was the
third consecutive month in which the labour force grew more quickly than
employment. If the instincts of the job searching workers are right,
further strong employment gains should be seen in coming months.
Global Impact
As usual, the labour market improvement is not an unambiguous benefit for
equity markets since it immediately raises questions about how the Federal
Reserve is likely to react and whether resulting action to raise interest
rates once again threatens an ongoing expansion.
From a global perspective, relatively benign US economic conditions raise the question of whether the US has sufficient momentum to drag the rest of the world from its economic malaise or whether the US is going to be dragged down by the absence of growth momentum elsewhere.
Unfortunately, the days when the US economy could act as the locomotive for the rest of the world appear to have passed forever.
While much of the current US political debate centres on whether the US can be ‘great again’, the need to have the debate is probably indicative of the answer. There are good reasons to infer from the ongoing debate that the US is moving into a prolonged period of policy paralysis in historical fantasies prevail and intra-party disagreements prove as strong as those between the historical GOP and Democrat protagonists.
In failing to recognise that the USA can no longer claim a disproportionate share of the world’s economic resources, the contenders for US political leadership (and the population at large) will be in no fit shape to frame practical policies from which it can extract better growth outcomes.
Gold at Critical Point
The US dollar gold price has added $200/oz or 19% since early December 2015
to take it to the very top of the channel within which it has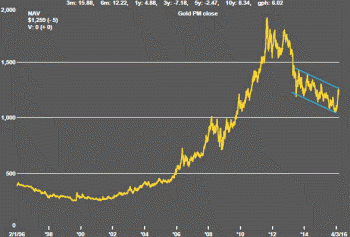 traded since 2013. The closing price on Friday could be construed as having
opened a crack at the upper end of the channel but nothing more conclusive
for now (although the next few days will warrant watching closely).
traded since 2013. The closing price on Friday could be construed as having
opened a crack at the upper end of the channel but nothing more conclusive
for now (although the next few days will warrant watching closely).
Talk of negative interest rates would have supported the upward move in the gold price but how aggressively the Japanese and European central banks will pursue these policies remains unclear. Both have fallen well short of their rhetoric in the past. Repetitions of their prior failures to act will risk disappointment among gold investors. .