The Current View
Growth in demand for raw materials peaked in late 2010. Since then, supply growth has continued to outstrip demand leading to inventory rebuilding or spare production capacity. With the risk of shortages greatly reduced, prices have lost their risk premia and are tending toward marginal production costs to rebalance markets.
To move to the next phase of the cycle, an acceleration in global output growth will be required to boost raw material demand by enough to stabilise metal inventories or utilise excess capacity.
The PortfolioDirect cyclical
guideposts suggest that the best possible macroeconomic circumstances for
the resources sector will involve a sequence of upward revisions to
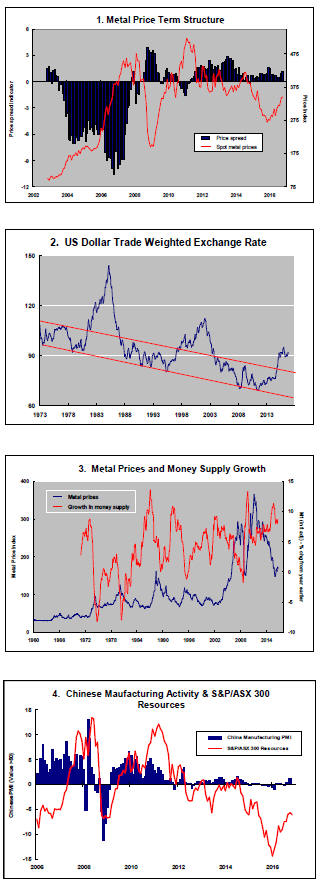
global growth forecasts, the term structure of metal prices once again
reflecting rising near term shortages, a weakening US dollar, strong money
supply growth rates and positive Chinese growth momentum. Only one of
the five guideposts is "set to green" suggesting the sector remains confined
to the bottom of the cycle .

Has Anything Changed? - Updated View
Since mid 2014, the metal market cyclical position has been characterised as ‘Trough Entry’ as prices have remained in downtrend with all but one of the PortfolioDirect cyclical guideposts - the international policy stance - flashing ‘red’ to indicate the absence of support.
The absence of a global growth acceleration, a stronger dollar and flagging Chinese growth momentum remain critical features of the current cyclical positioning.
Through February 2016, the first signs of cyclical improvement in nearly two years started to emerge. After 15 months of contango, the metal price term structure shifted to backwardation reflecting some moderate tightening in market conditions.
The metal price term structure is the most sensitive of the five cyclical guideposts to short term conditions and could, consequently, quickly reverse direction. Nonetheless, this is an improvement in market conditions and the guidepost indicator has been upgraded to ‘amber’ pending confirmation of further movement in this direction.
US Elections - A New Source of Growth
The U.S. presidential election will occur this week. Will the world be a
significantly different place for a resources sector investor by helping to
turn the cycle, as a result?
An abundance of U.S. national opinion polls reporting outcomes within their margins of error is suggesting a close tussle capable of resulting in either a Clinton or a Trump win.
Battleground state polling is showing some narrowing between voting intentions for the two candidates but with Clinton appearing to have the edge as she has more routes to power than Trump based on how states voted in 2012.
A Clinton victory will also depend on her being able to sustain enthusiasm among key constituencies, such as African Americans, which so strongly supported Barack Obama in 2008 and 2012.
A judgment about which of the two candidates should be preferred by the resources industry would depend on who is expected to deliver a stronger growth outcome or cause a weaker U.S. dollar.
 On
both counts, a Trump win might be preferable.
On
both counts, a Trump win might be preferable.
Both candidates have identified the decline of the American middle class as a critical electoral issue although Trump has appeared to resonate more strongly with disaffected white males who have suffered some of the worst living standard declines as manufacturing industries have closed, relocated or streamlined production.
Trump’s policies to cut taxes and rebuild derelict public infrastructure will almost certainly cause a budget blow-out. Consequently, Trump is out of favour with most mainstream economic commentators.
Whatever the preferred set of policies amongst economists, the Trump proposals will be good for growth, at least in the near term. They might also contribute to some initial weakening in the U.S. dollar.
Further ahead, larger budget deficits will require stronger fiscal surgery and a more rapid rise in interest rates than would have otherwise been necessary.
A Trump win, if it resulted in him doing what he has set out in his platform, would create a more volatile macro environment.
While volatility is normally thought of as bad for business, it is necessary to drive the cycles on which so much of the resources industry relies for its occasional bouts of prosperity.
A Trump victory would most probably come with a Republican controlled Senate and House of Representatives. This would be a historically rare result giving modern day Republicans a unique agenda setting opportunity.
Politically, it will make sense for President Trump, senate majority leader McConnell and House speaker Ryan to frame an agenda with which all three parts of government can agree to at last overcome years of legislative gridlock in Washington.
One could optimistically anticipate this being good for business with agreed corporate tax cuts and policies to rebuild infrastructure becoming likely as well as a lessening in Trump’s own anti-trade deal rhetoric.
Clinton, if she comes to power, is more likely to face a hostile legislature with at least one house under the control of Rpublicans. She is, like her critics complain, more likely than Trump to extrapolate existing policies rather than pursue new directions.
In any event, Republicans on Capitol Hill would attempt to hinder her at every opportunity, severely constraining her ability to initiate policy.
Overall, the marginally less likely outcome of a Trump victory appears the more beneficial for the resources industry.