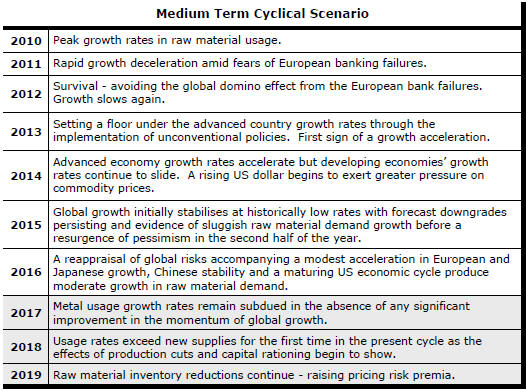
The Current View
Growth in demand for raw materials peaked in late 2010. Since then, supply growth has generally outstripped demand leading to inventory rebuilding or spare production capacity. With the risk of shortages greatly reduced, prices lost their risk premia and have been tending toward marginal production costs to rebalance markets.
The missing ingredient for a move to the next phase of the cycle is an acceleration in global output growth which boosts raw material demand by enough to stabilise metal inventories or utilise excess capacity.
The PortfolioDirect cyclical
guideposts suggest that the best possible macroeconomic circumstances for
the resources sector will involve a sequence of upward revisions to
global growth forecasts, the term structure of metal prices once again
reflecting rising near term shortages, a weakening US dollar, strong money
supply growth rates and positive Chinese growth momentum. Only one of the five guideposts is "set to green"
(after the most recent adjustments in July 2017) suggesting the sector remains confined
to near the bottom of the cycle.

Has Anything Changed? - Updated View
From mid 2014, the metal market cyclical position was characterised as ‘Trough Entry’ with all but one of the PortfolioDirect cyclical guideposts - the international policy stance - flashing ‘red’ to indicate the absence of support.
Through February 2016, the first signs of cyclical improvement in nearly two years started to emerge. The metal price term structure reflected some moderate tightening in market conditions and the guidepost indicator was upgraded to ‘amber’ pending confirmation of further movement in this direction.
As of early December 2016, the Chinese growth momentum indicator was also upgraded to amber reflecting some slight improvement in the reading from the manufacturing sector purchasing managers index. Offsetting this benefit, to some extent, the policy stance indicator was been downgraded from green to amber.
The most recent change in cyclical guidepost positioning has been at the end of July 2017 when the exchange rate guidepost was upgraded to green.
Cyclical Position
Thirty seven months after their peak, metal prices should have passed their nadir and be heading higher, as they are.
Time, of itself, is not important but the sequence of adjustments which contribute to higher prices and changed expectations takes time.
Currently, prices are running ahead of average historical outcomes suggesting scope exists for a pullback closer to the average outcomes over the past 60 years.
A pullback is not a necessary outcome but an alternative result would most likely require some combination of higher growth, further U.S. dollar weakness or a period of more supportive monetary policies.
There is no assurance presently that any of those three factors will favour the cycle progressing significantly beyond its present position.
The balance of risks suggests a more moderate appreciation in metal prices.
Global Growth - Forecast Revisions
Growth expectations have evolved in two important respects. Since 2013, as the chart illustrates, expectations have been lowered over successive forecast rounds. Secondly, the revised forecast appear to have come with lower downside risks.
Even as earlier forecasts had been lowered, risks of
something still worse had lingered when, for example, Greek debt and its
impact on European financial markets, had loomed as a potentially
catastrophic cause of economic disruption.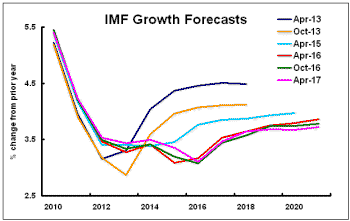
Reduced risks to world growth over the past several years warrants a more favorable view of mining investments insofar as the demand for metals underpinning industry revenues has become more sustainable.
Offsetting the benefit of a lower risk profile has been a global decline in productivity which has retarded the potential rate of global output growth. Prospective growth rates remain significantly below those which had prevailed prior to the 2008 financial crisis.
One consequence of lowered productivity outcomes has been a reduced rate of wages growth in advanced economies. With personal consumption accounting for up to 70% of GDP in these economies, wages outcomes can be an important driver of output growth or, depending on the circumstances, a heavy constraint on how quickly the pace of growth can accelerate.
The International Monetary Fund is due to release its latest global growth estimates for 2017 and beyond in the coming week in preparation for a meeting of member country finance ministers in Washington this month.
The head of the Fund’s research division has intimated that forecasts will at least be retained in the latest review - after many years of successive downgrades. That much is probably built into market expectations already.
Of greater interest will be the extent to which, if any, upward revisions are made. Upward revisions are a necessary ingredient for cyclical progress since they will imply greater than currently anticipated growth in raw material demand and a consequential further tightening in metal market balances.
US Dollar Exchange Rate - Chart 2
Much of the recent upward trajectory in metal prices has been contributed by a weaker U.S. dollar.
The currency adjustment has reflected some reappraisal of relative growth rates and the direction and pace of interest rate changes.
In particular, a rethink has occurred about the length of the lag between the U.S. Federal Reserve beginning to tighten its monetary policies and the European Central Bank going down the same path.
Expectations having been reset, a need for further changes in the exchange rate have probably receded.
With the prospect of a fiscal filip to the U.S. economy in 2018 and 2019 from tax cuts, a move higher in the U.S. dollar appears to have now become a stronger possibility - at least for the time being.
Once the legislative process gets underway more fully and two or three Republican senators express doubts about giving it their support, this possibility could quickly reverse.
International Policy Stance - Chart 3
Global monetary policies had been set to support higher asset prices as a step toward raising demand and creating stronger employment markets.
While the emphasis on these policies is being reduced as growth becomes more self sustaining, monetary accommodation remains historically strong.
Metal prices are affected by monetary conditions with a lag of several quarters so that there is no imminent threat from a winding back in monetary conditions but the prospective trajectory of monetary policy will be a source of eventual downward pressure on metal prices.
Metal Price Term Structure - Chart 1
Some modest tightening in nonferrous metal price spreads has been occurring over the past three months driven by emerging backwardations in London Metal Exchange lead and zinc prices.
The tightening in spreads is modest by the standards of what might be possible but overall physical market balances do not appear to be changing enough for the shift in premiums to move more dramatically.
The International Copper Study Group (ICSG) has reported that demand for the metal in the six months to June 2017 was 2.1% below the level of use over the corresponding period of 2016.
The ICSG has estimated that there was a 214,000 tonne increase in global metal inventories between the end of June 2016 and the end of June 2017.
With only moderately increasing or falling rates of usage across the major daily traded metals, relatively narrow metal price spreads may indicate market conditions are insufficiently strong to carry the cycle significantly further.
Chinese Growth Momentum - Chart 4
China has reported a modestly expanding manufacturing sector during September, consistent with outcomes over the past year.
Resource sector equity prices remain understandably
responsive to changes in Chinese activity, given the country's disproportionate
share of global metal consumption. 
While the current strength of Chinese raw material demand is a welcome sign for the industry, further gains remain highly dependent on the accommodative lending policies of the central government.
The dependence on financial leverage comes despite widespread agreement that the flow of funds is unsustainable and creating longer term distortions which will need addressing.
Suggestions of ‘good’ economic outcomes being contrived in the lead-up to the national congress of the Chinese communist party this month are based on signs of Xi Jinping wishing to consolidate his position as preeminent leader of the country.
Once the politics is out of the way and the central committee can focus more fully on longer term economic issues, cyclical risks for raw material markets are more likely to be biased to the downside.