The Current View
Growth in demand for raw materials peaked in late 2010. Since then, supply growth has generally outstripped demand leading to inventory rebuilding or spare production capacity. With the risk of shortages greatly reduced, prices lost their risk premia and have been tending toward marginal production costs to rebalance markets.
The missing ingredient for a move to the next phase of the cycle is an acceleration in global output growth which boosts raw material demand by enough to stabilise metal inventories or utilise excess capacity.
The PortfolioDirect cyclical
guideposts suggest that the best possible macroeconomic circumstances for
the resources sector will involve a sequence of upward revisions to
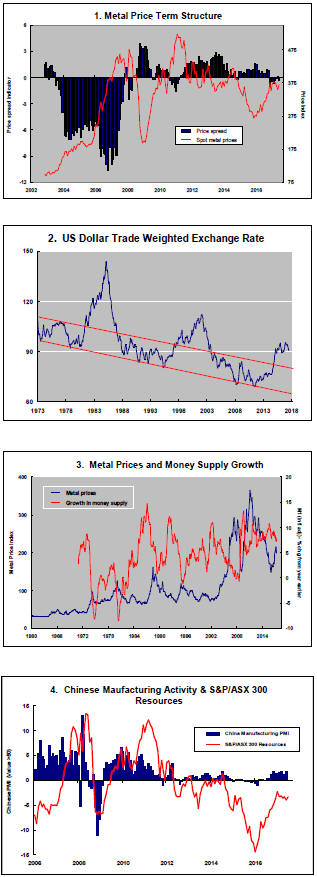
global growth forecasts, the term structure of metal prices once again
reflecting rising near term shortages, a weakening US dollar, strong money
supply growth rates and positive Chinese growth momentum. None of the five guideposts is "set to green"
(after the most recent adjustments in December 2016) suggesting the sector remains confined
to near the bottom of the cycle.

Has Anything Changed? - Updated View
From mid 2014, the metal market cyclical position was characterised as ‘Trough Entry’ with all but one of the PortfolioDirect cyclical guideposts - the international policy stance - flashing ‘red’ to indicate the absence of support.
Through February 2016, the first signs of cyclical improvement in nearly two years started to emerge. The metal price term structure reflected some moderate tightening in market conditions and the guidepost indicator was upgraded to ‘amber’ pending confirmation of further movement in this direction.
As of early December 2016, the Chinese growth momentum indicator was also upgraded to amber reflecting some slight improvement in the reading from the manufacturing sector purchasing managers index. Offsetting this benefit, to some extent, the policy stance indicator has been downgraded from green to amber. While monetary conditions remain broadly supportive, the momentum of growth in money supply is slackening while further constraints on fiscal, regulatory and trade regimes become evident.
US Labour Market Doubts Raise Questions About
Growth
The latest monthly labor market report released on Friday by the U.S.
government buoyed equity prices but highlighted a clear gap in the
understanding of economists about the sources of inflation.
More worryingly, the statistics reinforced the
possibility that policy is based on a false premise. 
The U.S. Department of Labor reported that the number of non-farm jobs had risen in June by 222,000.
The increase in the number of new payrolls was consistent with the 185,000 average number of jobs added each month since the beginning of 2010.
The number of new jobs each month has also been running at about the same rate as had prevailed during economic expansions prior to the 2008-09 financial crisis, although the percentage change is slightly lower more recently due to growth in the overall employment base.
The June increase in payroll numbers was also higher than the number of new jobs needed to absorb entrants into the labor force.
The resulting 4.4% unemployment rate is 0.3 percentage points lower than at the end of December and less than policymakers had once thought possible.
The preparedness of Federal Reserve governors to extrapolate recent employment growth patterns in the year ahead has resulted in the central bank policymaking committee forecasting a median unemployment rate for the end of 2018 of 4.2%, according to material published in June.
Policymakers’ forecasts imply that currently low unemployment rates are unsustainable. In the longer term, expected unemployment rises. The median rate of 4.6% suggests post-2019 employment growth will no longer be sufficient to match labour force increases.
Federal Reserve forecasts imply some skepticism about future rates of employment increase.
The Federal Reserve, as the principal economic policymaking body within the U.S. system of governance, has been caught out by the extent to which employment has grown.
Forecasting has been complicated by changing participation rate patterns arising from complex demographic trends, technology shifts and changes in the structure of employment.
Financial markets have been more inclined to extrapolate actual outcomes rather than take at face value what the Fed says about the outlook.
 By
now, according to the Fed policy paradigm, labor demand should be so strong
that inflation is on the rise prompting a series of interest rate rises to
avert a dangerous change in inflation expectations.
By
now, according to the Fed policy paradigm, labor demand should be so strong
that inflation is on the rise prompting a series of interest rate rises to
avert a dangerous change in inflation expectations.
Contrary to the basic model, wages have not shown signs of significantly stronger growth. Pockets of industry in which there have been shortages of specialised labour have experienced stronger wages growth but, by and large, wages have been well contained by historical standards.
Friday’s labour market report put the monthly rise in average hourly earnings at 0.2% for an increase over the year of 2.4%.
The seemingly subdued growth in wages is consistent with weaker productivity growth than has historically occurred. Some tendency for older workers to be replaced by younger less well paid employees may also be affect outcomes.
Wage growth is also consistent with a more competitive global economy in which freer movement of capital, worker migration and flexible exchange rates help prevent isolated national outbreaks of wage inflation.
This common backdrop has meant a convergence in wages growth among advanced economies including reductions in countries like Australia which had experienced relatively high rates of wages growth in the past.
From a resources sector standpoint, judgments about wages growth are important because household consumption is ultimately limited by wages outcomes. Consumption underpins demand in advanced economies which account for nearly one-half of the global output dictating levels of raw material demand.
At some stage, the Federal Reserve may have to rethink its policymaking framework if there is no wages and inflation response to improved employment demand in the near future.
In the coming week, chair Yellen will inevitably have to say something on this topic as she gives her semi-annual Humphrey-Hawkins testimony before the U.S. Congress.
Meanwhile, markets seem to have interpreted the monthly labour force numbers as containing the right balance to justify a further rise in equity prices.
The employment rise seems to have been interpreted as being consistent with ongoing economic expansion but not cause for a more aggressive tightening in policy than what has already been outlined.
The labor report also seems to point to the balance of policy risks being on the side of less tightening rather than more with falling confidence in the expected connection between employment growth and wages and, in turn, between wages and inflation.
All of that suggests low risks of upside growth surprises and consequently slow progress along the path to greater cyclical strength in demand for raw materials.
Such an inference favours modest improvement in sector equity prices in response to lowered market volatility but no re-pricing of sector values in anticipation of a stronger cyclical upswing than already embedded in stock prices. .