The Current View
Growth in demand for raw materials peaked in late 2010. Since then, supply growth has generally outstripped demand leading to inventory rebuilding or spare production capacity. With the risk of shortages greatly reduced, prices lost their risk premia and have been tending toward marginal production costs to rebalance markets.
The missing ingredient for a move to the next phase of the cycle is an acceleration in global output growth which boosts raw material demand by enough to stabilise metal inventories or utilise excess capacity.
The PortfolioDirect cyclical
guideposts suggest that the best possible macroeconomic circumstances for
the resources sector will involve a sequence of upward revisions to
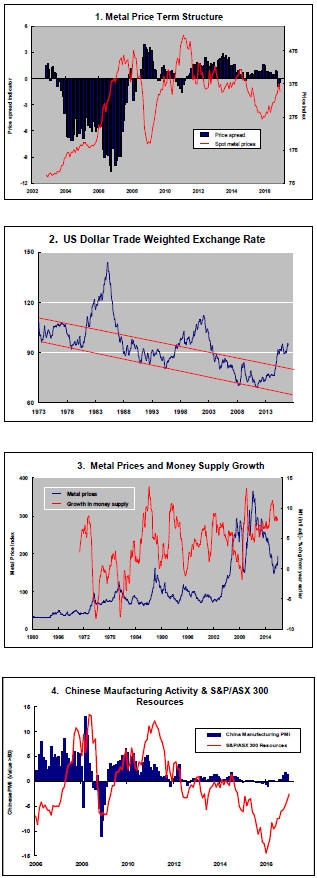
global growth forecasts, the term structure of metal prices once again
reflecting rising near term shortages, a weakening US dollar, strong money
supply growth rates and positive Chinese growth momentum. None of the five guideposts is "set to green"
(after the most recent adjustments in December 2016) suggesting the sector remains confined
to near the bottom of the cycle.

Has Anything Changed? - Updated View
From mid 2014, the metal market cyclical position was characterised as ‘Trough Entry’ with all but one of the PortfolioDirect cyclical guideposts - the international policy stance - flashing ‘red’ to indicate the absence of support.
Through February 2016, the first signs of cyclical improvement in nearly two years started to emerge. The metal price term structure reflected some moderate tightening in market conditions and the guidepost indicator was upgraded to ‘amber’ pending confirmation of further movement in this direction.
As of early December 2016, the Chinese growth momentum indicator was also upgraded to amber reflecting some slight improvement in the reading from the manufacturing sector purchasing managers index. Offsetting this benefit, to some extent, the policy stance indicator has been downgraded from red to amber. While monetary conditions remain broadly supportive, the momentum of growth in money supply is slackening while further constraints on fiscal, regulatory and trade regimes become evident.
Where are All The Closures?
The impact of zinc mine closures has been a zinc market
investment theme for several years but the production losses are not having
the expected effects.
In choosing investments, investors have been urged by promoters for several years to think of zinc miners as being in a preferred position. Only lithium, among the metal complex, has attracted more ebullient forecasts.
The size of anticipated cuts in zinc mine production
were expected to impact the amount of metal being produced and tilt market
balances toward deficit. 
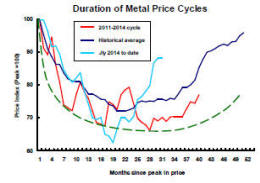
The adjacent chart, based on end of year metal stock data published by the International Lead Zinc Study Group (ILZSG), shows how the strongest cyclical price increases occur when inventories of metal decline.
The stock estimate highlighted in the chart for the end of 2016 reflects the comment in the January 2017 report from the ILSG that total reported inventories had fallen by just 72,000 tonnes over the first 11 months of the year.
The small fall in reported inventories was well short of what many had expected as a result of scheduled mine closures in 2015.
As late as October 2016, the ILZSG said that “the Group anticipates that world zinc mine production will fall by 5.6% to 12.47 million tonnes in 2016”. It expected a 3.2% drop in zinc metal output.
According to the latest ILSG statistics, mine output was just 1.2% lower over the first 11 months of 2016 and metal production was sitting within an insignificantly small 2,000 tonne drop.
Production in 2016 now appears unlikely to have been significantly different from the production rate in 2015, despite the mine closures which have occurred.
The apparent misjudgment about production outcomes within the zinc industry highlights a common failing in attempts to forecast metal market conditions.
In forecasting supply outcomes, taking account of high profile announced mine closures or openings is relatively straightforward. The typical investment bank research report will contain lists of the most important and even changes among some lesser mines where analysts’ judgments have been exercised to draw conclusions about likely production variations.
Analysts, and the industry itself, are less well equipped to assess the impact on overall supply of dozens of individual production shifts many of which may appear trivial but which, together, can have a meaningful impact on market balances.
Since 2000, annual zinc mine output has risen by 4.3 million tonnes, equivalent to around eight of the world’s largest mines or over 40 mines of the size that would rank them around tenth in terms of output size. Mines of this size have not been a feature of the zinc market. Output has growth has been driven through the infusion of large numbers of small properties.
Oftentimes, no announcement will have been made about company intentions and there may be too many for an analyst to track. One can think of 50 mines each pushing up production by 3,000 tonnes in response to stronger demand. Individually, they may not be see as significant but the total of 150,000 tonnes would be enough to move a market from surplus into deficit.
So small are the variations analysts are attempting to track that they stand little hope of achieving the needed level of accuracy.
The mining industry is capable of supplementing base load production with smaller tonnages from mines which may remain operational only briefly. Occasionally, output surges may temporarily supplement base production.
By the time an analyst has turned his attention to the new output, it might have already been terminated.
Forecasters almost always fail to consider the impact of their forecasts on the intentions of mine operators. A consensus that prices are going to improve will encourage miners to raise production even if only slightly.
The view that zinc mine closures would result in a shortage of metal might have been so persuasive that the industry prevented it from happening.
All of these effects appear to have influenced recent zinc market outcomes on the supply side.
Another influence on the market balance has been weaker than expected usage rates.
The same promoters using delays in supply side adjustments to support arguments in favour of zinc-related companies as investments had taken for granted the likelihood of continuing growth in usage rates.
Now, the ILZSG is estimating that usage in 2015 was 2.0% lower than in 2014, equivalent to a loss of 273,000 tonnes against the prior year and a loss of over 400,000 tonnes against what would have been achieved if use had grown at a historically average rate. Both amounts are meaningful variations in pushing the market between surplus and deficit.
It is unsurprising for zinc prices to have firmed to some extent against a backdrop of improved sentiment about global macroeconomic risks. More optimistic views about economic outcomes have benefited several key mining commodities including iron ore, copper and coal.
The incoming data raise doubts about zinc market conditions remaining unusually strong or sustainably stronger than market conditions in other commodity segments.