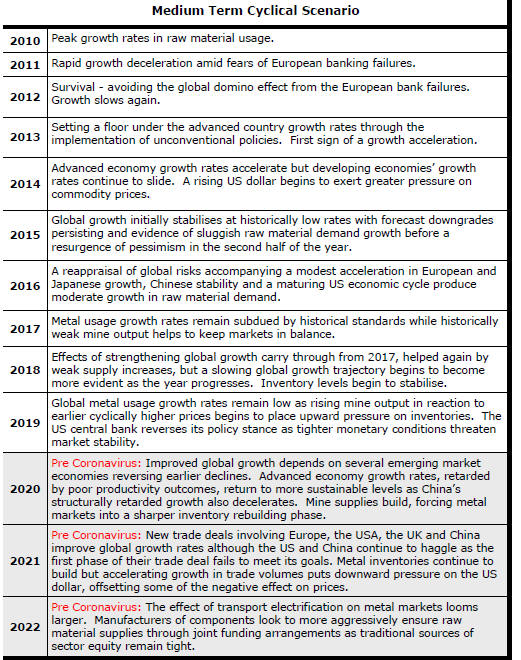
The Current View
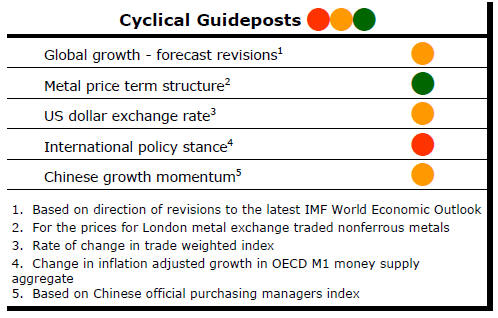
The PortfolioDirect cyclical guideposts suggest that the best possible macroeconomic circumstances for the resources sector will involve a sequence of upward revisions to global growth forecasts, the term structure of metal prices once again reflecting rising near term shortages, a weakening US dollar, strong money supply growth rates and positive Chinese growth momentum.
Most of the five guideposts are "flashing amber" suggesting a directional change could be commencing but that data remain equivocal with the distorting effect of the 2020 economic slump hiding some of the underlying trends which point to reversal of currently more favourable conditions.
Has Anything Changed? - Updated View
From mid 2014, the metal market cyclical position was characterised as ‘Trough Entry’ with all but one of the PortfolioDirect cyclical guideposts - the international policy stance - flashing ‘red’ to indicate the absence of support.
Through February 2016, the first signs of cyclical improvement in nearly two years started to emerge. The metal price term structure reflected some moderate tightening in market conditions and the guidepost indicator was upgraded to ‘amber’ pending confirmation of further movement in this direction.
As of early December 2016, the Chinese growth momentum indicator was also upgraded to amber reflecting some slight improvement in the reading from the manufacturing sector purchasing managers index. Offsetting this benefit, to some extent, the policy stance indicator was downgraded from green to amber.
At the end of July 2017, the exchange rate guidepost was upgraded to green.
As 2017 ended, there were emerging signs of economic forecasters beginning a sequence of growth forecast upgrades prompting a revision of the global growth guidepost to "green".
Three quarters of the way through 2018, global growth appears to have peaked and the US dollar is on the rise both warranting guidepost downgrades. The cyclical positioning has been downgraded to 'downswing'.
As 2019 commences, the balance of cyclical forces is more sharply negative. Global growth forecasts are coming down and Chinese growth momentum is facing stronger headwinds.
The early 2020 COVID-19 pandemic has aggravated a tendency to cyclical weakness which had become evident as much as a year earlier.
The unprecedented policy changes by governments and central banks in response to the damaging effects of the COVID-19 pandemic, including support for swift vaccine manufacture, have tended to swamp negative tendencies elsewhere. Expectations about the near term pace of economic growth, although much improved at the start of 2021, conceal an implied underlying slowdown once the 2020 base effect has passed, leaving most guideposts stalled on amber.
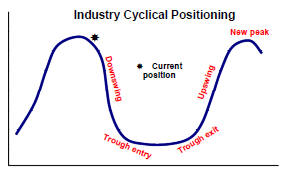
Cyclical Position
The COVID-19 outbreak was an additional source of downward cyclical pressure which potentially defined the beginnings of a fresh cycle.
The level and direction of metal prices, prior to the COVID-19 outbreak, had generally been consistent with a cyclical downswing dating from February 2018. Very strong rises in nickel prices offset weakness in the prices of other metals during much of 2019, limiting the extent of the weakness in the cyclical price indicator.
To avert further price weakness would have needed some combination of higher global growth than previously anticipated, U.S. dollar weakness or more supportive monetary policies.
The coronavirus outbreak heightened the need for all those factors to move in concert and by a far greater extent than would have been needed to avert further cyclical decline.
The unprecedented response by governments and central banks to the the damaging effects of the COVID-19 pandemic has averted the tendencies to weaker prices which had been apparent and has fed a strong cyclical uplift.
Official actions, which have left markets almost wholly dependent on unsustainable government largesse, have also concealed continuing negative effects, including the tendency for slower economic growth through 2021 as the worst economic effects of the pandemic pass.
Global Growth - Forecast Revisions
Forecasters had been warning that global economic growth had begun a lengthy stretch on a lower growth trajectory well before the impact on economic activity of the COVID-19 outbreak.
The expected synchronised growth which had driven
expectations through late 2017 and early 2018 (and which would have been
critical to an impro vement in mining industry fortunes)
had dissipated quickly.
vement in mining industry fortunes)
had dissipated quickly.
The International Monetary Fund confirmed its view, in the October 2018 World Economic Outlook and again in April 2019, that global growth is likely to have reached a peak during the latter part of 2017.
The Fund cut back its 2019 and 2020 growth forecasts in its October 2019 review of the world economy even before taking account of a COVID-19 impact.
The momentum of economic activity has improved as lockdown measures in the advanced economies and in China have been eased. Optimism about the sustainability of economic activity has risen as vaccines have been approved and the initial stages of the mass vaccination efforts have commenced.
T he evident optimism about activity rates has been tempered by continuing
restrictions on face to face contact and fears about more virulent virus
strains placing a lid on the level of activity in post-pandemic economies.
The long term effectiveness of the new vaccines also remains in question as
does the speed of the vaccine roll-out beyond the richest countries which
have bankrolled the vaccine production surge and have access to the first
supplies.
he evident optimism about activity rates has been tempered by continuing
restrictions on face to face contact and fears about more virulent virus
strains placing a lid on the level of activity in post-pandemic economies.
The long term effectiveness of the new vaccines also remains in question as
does the speed of the vaccine roll-out beyond the richest countries which
have bankrolled the vaccine production surge and have access to the first
supplies.
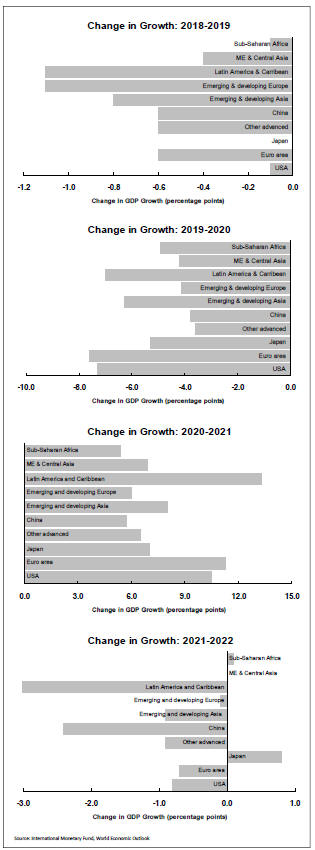
Substantially lower output levels in 2020 are expected to be a base for unusually high 2021 global growth outcomes. Even then, activity may not reach end-2019 levels until 2022 or beyond for many national economies
The following year, 2022, is closer to the ongoing reality with already declining underlying growth impacting most economic regions.
Recently positive variations in IMF growth forecasts have resulted from judgments having been made that 2020 outcomes were not as bad as feared rather than positive assessments about the underlying pace of growth going forward. Prospects for raw material demand will hinge on the latter.
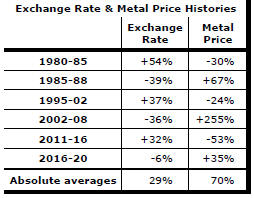
US Dollar Exchange Rate - Chart 2
Over the past 45 years, a 1% fall/rise in the US dollar trade weighted index has come with an average rise/fall of 3% in nonferrous metal prices.
The US dollar has moved lower since mid May 2020 as
evidence mounted that relative interest rates and near term growth
performance would not favour the US as much as had been expected. The
directional change in the currency has warranted an upgrade from red to
amber in the cyclical guidepost.
warranted an upgrade from red to
amber in the cyclical guidepost.
Along with reduced risks to growth, a weaker U.S. dollar has been contributing to the upward trajectory in metal prices.
Swings in sentiment about the progress being made in stifling the spread of the COVID-19 virus are likely to add volatility to the currency.
Relatively strong US bond and equity markets have attracted investors to US dollar denominated assets. The safe haven status of US assets has most likely sustained an upward bias to the US currency, preventing it from reverting to the lower levels from which it had risen in 2014.
Steps taken to counter COVID-19 are adding to the size of
the US government deficit, the speed of government debt accumulation and, in the absence of the
US central bank, the bond
selling task.
In the years ahead, relatively moderate US growth outcomes and rising US debt are likely to push the currency toward its longer term downward trajectory.
Greater optimism about the overall global growth picture, or a compression of growth differences between the US and other countries, is also likely to take its toll on the currency as capital flows into other countries strengthen.
Longer term trends herald support for US dollar denominated commodity prices, including gold.
International Policy Stance - Charts 3&4
Policy, as it impacts the mining industry, emanates most crucially from central banks but government counter-cyclical fiscal policies and structural initiatives designed to enhance productivity outcomes and facilitate the free flow of trade also play important roles.
Prior to the onset of the COVID-19 pandemic, the US Federal Reserve had flagged it was happy with its policy settings, guiding markets to expect little or no change for the foreseeable future. After January 2020, the Fed moved its policy rate down to near zero and flagged a willingness to aggressively buy corporate securities to stabilise financial markets and shore up asset prices.
Concerted central bank action has supplemented large increases in government spending to mitigate the effects on economic activity of widespread job losses.
While unprecedented, the central bank and government actions will not have fully compensated for the loss of output arising from forced business closures and abandoned private sector investment projects. As a consequence, national economies are experiencing significant excess capacity and further downside risks to activity rates.
Central bank action has helped to prevent a financial crisis by ensuring adequate system liquidity but the impact of easier monetary conditions on the real economy is limited due to public health measures prohibiting or constraining economic activity.
In the absence of an effect on the real economy, the unprecedentedly strong infusion of global liquidity has helped stoke asset prices, including the prices of those commodities of particular importance to the mining industry.
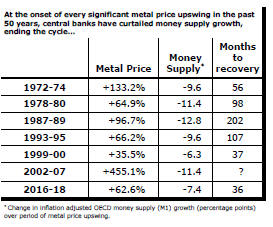
The greatest danger to a metal price cycle comes when monetary policy settings begin to tighten in response to higher inflation with an adverse effect on output growth and investment spending.
In previous cycles, authorities have moved to stem monetary growth rates while metal prices have been on the rise, sometimes quite aggressively, in an effort to prevent the rise of inflation pressures. The tightening in policy has typically cut short price cycles.
With the economic effects of the COVID-19 pandemic expected to be long-lasting, central banks are unlikely to begin a policy tightening phase for many months and even possibly several years. The first signs of a change in the policy stance will be a slowing in the rate of monetary expansion.
Metal Price Term Structure - Chart 1
The tightening in nonferrous metal forward price spreads evident through 2018 gave way to signs of less market concern about supply availability. More recently, price spreads have been moderately contracting, pointing to some emerging constraints on supply.
 Despite
historically slow growth in demand for the past several years, inventory
expansion had been limited by weak supply growth, keeping markets close to
balance.
Despite
historically slow growth in demand for the past several years, inventory
expansion had been limited by weak supply growth, keeping markets close to
balance.
The International Copper Study Group (ICSG) has reported that demand for copper in 2020 outside China will have contacted by 10%. An offsetting surge in Chinese apparent use is based on a large increase in imports which most likely conceals a build up in inventories and the prospect of an offsetting contraction in 2021 apparent consumption.
The succession of million tonne-plus increases in annual copper usage during the first decade of the century, requiring new metal making capacity, is not being reproduced.
The International Lead Zinc Study Group has reported that zinc usage has not changed significantly since 2013 after an estimated fall of 4.4% in 2020.
Some part of the constraints on the supply side have been involuntary
insofar as permitting times have blown out and development finance has been hard to
access. Especially
 in
the case of zinc, mine closures due to mineral exhaustion have had an
effect.
in
the case of zinc, mine closures due to mineral exhaustion have had an
effect.
Some other production cuts can be reversed in the event demand growth accelerates.
The pipeline of development properties has begun to grow more strongly, leaving markets likely to experience a stronger flow of metal in 2021 and the following years.
Depending on the severity of COVID-19 usage constraints, inventory building could occur during 2021 and for a year or two after without changes to current production intentions.
Chinese Growth Momentum - Chart 5
Chinese growth was destined to head lower in coming years
but China has consistently met annual statistical goals through periodic growth surges
when necessary, stalling the inevitable.

Successive quarterly growth outcomes of 1.2% in the second and third quarters of 2019 were the slowest rates in a decade, pointing more conclusively to a downward shift in the momentum of economic activity.
In the absence of market reforms comparable in importance to those which have occurred historically, the sensitivity of growth to monetary and fiscal policy changes in China has been falling.
The restructuring of the Chinese economy with a resulting contraction in the contribution to Chinese GDP of investment spending would have had a generally detrimental effect on raw material demand.
Signs of subdued Chinese investment momentum have been evident in statistics released by the International Copper Study Group and the International Lead Zinc Study Group which have shown unusually weak growth in metal use over the past several years.
China's loss of production in the first quarter of 2020, with the onset of COVID-19 lockdown arrangements, will affect the pattern of growth for several quarters.
A strong recovery through the second half of 2020 will have meant China had one of the smallest output contractions of any country. Growth for 2021, in the absence of any contraction this year, will exceed what would have otherwise been expected and come out well ahead of the 2019 outcome.
A reversion to the rate of expansion evident prior to the COVID-19 outbreak implies a deceleration in annual growth toward 5% with considerably lessened chances of China providing the mining industry with the periodic surges in demand which have contributed to the tighter market conditions than would have otherwise prevailed.
Even weaker outcomes than the 5% pace might persist in the absence of a full recovery and restoration of improved growth elsewhere in the world.