The Current View
Growth in demand for raw materials peaked in late 2010. Since then, supply growth has continued to outstrip demand leading to inventory rebuilding or spare production capacity. With the risk of shortages greatly reduced, prices have lost their risk premia and are tending toward marginal production costs to rebalance markets.
To move to the next phase of the cycle, an acceleration in global output growth will be required to boost raw material demand by enough to stabilise metal inventories or utilise excess capacity.
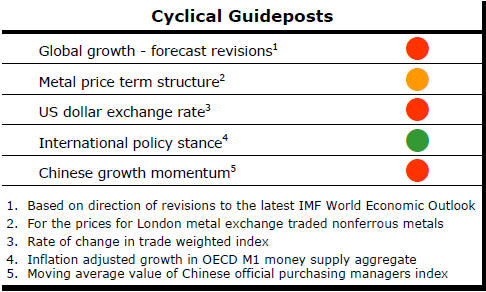
The PortfolioDirect cyclical
guideposts suggest that the best possible macroeconomic circumstances for
the resources sector will involve a sequence of upward revisions to
global growth forecasts, the term structure of metal prices once again
reflecting rising near term shortages, a weakening US dollar, strong money
supply growth rates and positive Chinese growth momentum. Only one of
the five guideposts is "set to green" suggesting the sector remains confined
to the bottom of the cycle .
Has Anything Changed? - Updated View
Since mid 2014, the metal market cyclical position has been characterised as ‘Trough Entry’ as prices have remained in downtrend with all but one of the PortfolioDirect cyclical guideposts - the international policy stance - flashing ‘red’ to indicate the absence of support.
The absence of a global growth acceleration, a stronger dollar and flagging Chinese growth momentum remain critical features of the current cyclical positioning.
Through February 2016, the first signs of cyclical improvement in nearly two years started to emerge. After 15 months of contango, the metal price term structure shifted to backwardation reflecting some moderate tightening in market conditions.
The metal price term structure is the most sensitive of the five cyclical guideposts to short term conditions and could, consequently, quickly reverse direction. Nonetheless, this is an improvement in market conditions and the guidepost indicator has been upgraded to ‘amber’ pending confirmation of further movement in this direction.
Easing Growth Momentum
The latest OECD leading economic indicators are pointing to a continuing
loss of worldwide growth momentum.
Amongst the major advanced economies, the outlook is for less volatility and slower growth.
In earlier periods, swings in growth momentum which
created headaches for policymakers, nonetheless, brought benefits for the
mining industry.

When growth rates fluctuated over relatively short time frames, the chances of a mismatch between supply and demand rose.
A necessary condition for a commodity price cycle is an unanticipated change in the pattern of growth. If the mining industry fails to adequately adjust to changing conditions, the ensuing surpluses for deficits will underpin a change in prices to help restore balance.
The developing economies are providing only limited relief from the low growth outlook among the advanced economies.
 Brazil
and Russia are showing signs of having past the worst of their recessions
but both remain heavily constrained by a combination of incomplete economic
adjustments and political events constraining more robust outcomes.
Brazil
and Russia are showing signs of having past the worst of their recessions
but both remain heavily constrained by a combination of incomplete economic
adjustments and political events constraining more robust outcomes.
India is in a similar phase of its growth cycle but does not have as a severe a political constraint on its future growth although it, too, must achieve politically sensitive domestic reforms to be able to realise its potential.
Bond Prices Pressure Gold
Gold prices are a product of a complex combination of financial market
variables which also vary over time in their relative importance making
forecasting particularly difficult.
In recent times, gold prices have been heavily
influenced by the ebb and flow of expectations about U.S. interest rates.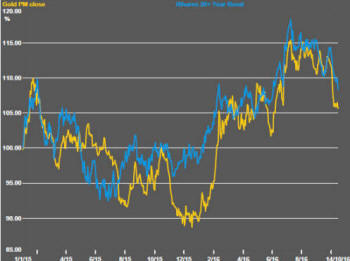
The swing in bullion prices through the first part of 2016 was affected by a changed perspective about the speed of interest rate rises in the USA.
The widening realisation that the U.S. Fed would be less aggressive in normalising interest rates than previously thought likely helped sustain higher gold prices.
The US Federal Reserve appears closer now to implementing another rate rise but there has also been talk among Federal Reserve officials that they may allow inflation to exceed their previously stated 2% target if it helped growth outcomes.
Perceptions of some greater willingness to accept inflation have helped push bond yields higher.
The relationship between the gold price and government bond yields places some onus on anyone arguing for a higher gold price.
In particular, company executives basing production decisions on stable or higher gold prices should be asking themselves what that means about implied bond prices and whether reasonable bond price expectations are consistent with the wished-for behaviour in the gold market.
Chinese Trade Shows Growth Slowdown
Chinese officials have reported that the value of the country’s exports fell
by 3.2% in August from the corresponding period a year earlier. Over the
same period, imports were 1.4% higher.
 The
longer term trade trends show both imports and exports having fallen.
The
longer term trade trends show both imports and exports having fallen.
The decline in imports has been more rapid than the decline in export values leading to a widening trade surplus which most countries would welcome.
The trade outcomes are the result of a mixture of domestic and international economic influences.
Lower global growth has pared back Chinese exports. The fall in imports reflects, to some extent, the reduced needs for manufacturing inputs as a result of the cutback in exports but also arises from slowing domestic demand.


