The Current View
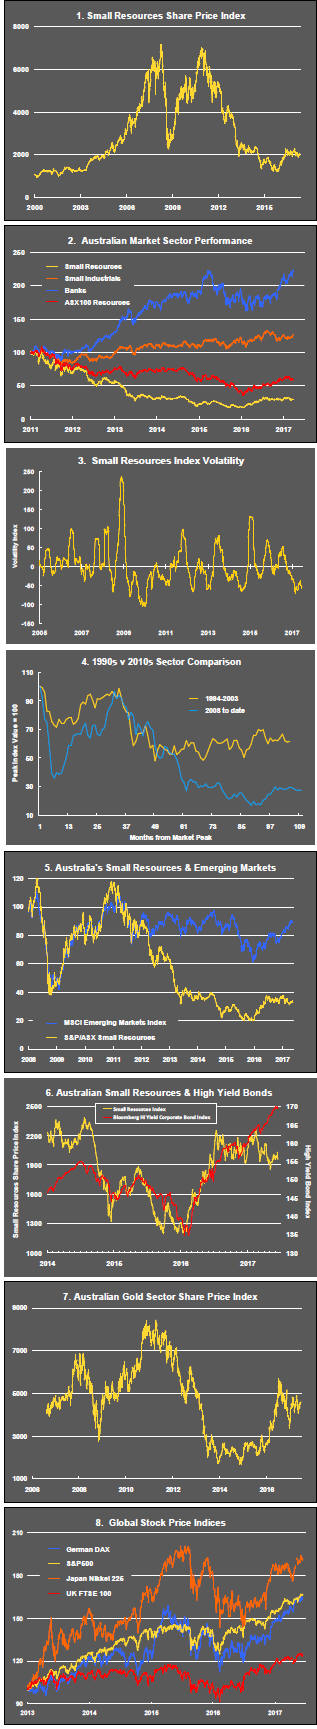
A lengthy downtrend in sector prices had given way to a relatively stable trajectory after mid 2013 similar to that experienced in the latter part of the 1990s and first few years of the 2000s.
The late 1990s and early 2000s was a period of macroeconomic upheaval during which time sector pricing nonetheless proved relatively stable.
Relative stability suggests a chance for companies genuinely adding value through development success to see their share prices move higher. This was the experience in the late 1990s and early 2000s.
Still vulnerable cyclical conditions were aggravated in the second half of 2015 by a push from investors worldwide to reduce risk. Sector prices were pushed to a new cyclical low. These conditions were largely reversed through the first half of 2016 although sector prices have done little more than revert to mid-2015 levels.
With a median decline in prices of ASX-listed resources companies through the cycle of 89%(and 30% of companies suffering a decline of more then 95%), the majority of stocks remain prone to strong 'bottom of the cycle' leverage in response to even slight improvements in conditions.
Has Anything Changed?
A 1990s scenario remains the closest historical parallel although the strength of the US dollar exchange rate since mid 2014 has added an unusual weight to US dollar prices.
The first signs of cyclical stabilisation in sector equity prices have started to show. This has meant some very strong ‘bottom of the cycle’ gains.
Funding for project development may have passed its most difficult phase at the end of 2015 with signs of deals being done and evidence that capital is available for suitably structured transactions.
Key Outcomes in the Past Week

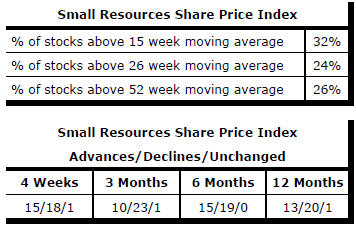
Market Breadth Statistics

Investors are paying near record prices for S&P 500 earnings.
The chart shows the track of quarterly earnings since 1988 against the index level.
The dashed lines show the boundaries associated with earnings multiples of 15 and 20.
Based on the latest earnings estimate for the March quarter of 2017, the index has surpassed the high end of the valuation range in which it has traded over the past 25 years.
Investors are showing a high level of confidence about the ongoing growth in earnings in their current pricing of the market.

Since early March 2017, the iron ore price has fallen 40% while the copper price has changed little. The difference in performance is somewhat unusual insofar as the principal drivers of the prices of the two products are similar.
Iron ore and copper demand are both largely driven by changes in global output growth and, more specifically, by economic growth in China which accounts for half of the use of both commodities.
Over the past six years, since iron ore pricing has changed from having been negotiated under contract to a heavier emphasis on spot prices, the prices of the two commodities have generally moved in the same direction although the iron ore price has displayed greater volatility.
Copper prices may be less volatile because they are set in more mature and liquid markets. That might suggest iron ore prices are going to be more sensitive to small changes in macro drivers which would mean, in turn, a more significant chance that copper prices will eventually follow an iron ore price movement.
The iron ore market may have similar characteristics to the market for crude oil insofar as producers are more responsive to price signals than in the copper market. This possibility would suggest that iron ore prices will remain the more volatile of the two commodities.
The greater susceptibility of one of the commodities to swings in market conditions might suggest that the correlation in prices between the two commodities will fall over time.

Gold prices are in the unique position of benefiting from both stronger global growth and weaker growth.
Stronger growth contributes to rising wealth which supports demand for gold as a store of value.
Weaker growth gets reflected in lower bond yields (and higher bond prices) which improves the competitiveness of gold as a financial asset and causes it to be re-priced.

A weaker U.S. dollar also supports higher U.S. dollar denominated gold prices. The weighted index of U.S. dollar values has fallen 5.7% since April during which time the gold price has risen 13.3%.
.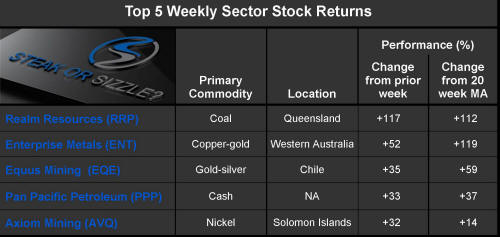
The Steak or Sizzle? blog LINK contains additional commentary on the best performed stocks in the sector and the extent to which their investment outcomes are underpinned by a strong enough value proposition to sustain the gains.