The Current View
The PortfolioDirect cyclical guideposts suggest that the best possible macroeconomic circumstances for the resources sector will involve a sequence of upward revisions to global growth forecasts, the term structure of metal prices once again reflecting rising near term shortages, a weakening US dollar, strong money supply growth rates and positive Chinese growth momentum.
All five guideposts are now "red" or "flashing amber" with the final shoe - the metal price term structure - having fallen with the hitherto persistent tendency to backwardation having been eroded.

Has Anything Changed? - Updated View
From mid 2014, the metal market cyclical position was characterised as ‘Trough Entry’ with all but one of the PortfolioDirect cyclical guideposts - the international policy stance - flashing ‘red’ to indicate the absence of support.
Through February 2016, the first signs of cyclical improvement in nearly two years started to emerge. The metal price term structure reflected some moderate tightening in market conditions and the guidepost indicator was upgraded to ‘amber’ pending confirmation of further movement in this direction.
As of early December 2016, the Chinese growth momentum indicator was also upgraded to amber reflecting some slight improvement in the reading from the manufacturing sector purchasing managers index. Offsetting this benefit, to some extent, the policy stance indicator was downgraded from green to amber.
At the end of July 2017, the exchange rate guidepost was upgraded to green.
As 2017 ended, there were emerging signs of economic forecasters beginning a sequence of growth forecast upgrades prompting a revision of the global growth guidepost to "green".
Three quarters of the way through 2018, global growth appears to have peaked and the US dollar is on the rise both warranting guidepost downgrades. The cyclical positioning has been downgraded to 'downswing'.
As 2019 commences, the balance of cyclical forces is more sharply negative. Global growth forecasts are coming down and Chinese growth momentum is facing stronger headwinds.
The early 2020 COVID-19 pandemic has aggravated a tendency to cyclical weakness which had become evident as much as a year earlier.
The unprecedented policy changes by governments and central banks in response to the damaging effects of the COVID-19 pandemic, including support for swift vaccine manufacture, tended to swamp negative tendencies elsewhere. Expectations about the near term pace of economic growth, although much improved at the start of 2021, conceal an implied underlying slowdown once the 2020 base effect has passed, leaving most guideposts stalled on amber.
As 2022 has progressed, the negative cyclical outlook has intensified. Favourable global monetary conditions were removed. Then the pace of global growth revisions picked up and, as US interest rates rose, the US dollar exchange rate became increasingly unfavourable. As the year is drawing to a close, the change in the metal price term structure has started to signal some easing in metal supply anxieties.
Cyclical Position
The unprecedented response by governments and central banks to the the damaging effects of the COVID-19 pandemic concealed pre-existing tendencies to cyclically weaker conditions.
With policy having switched from support for consumption and now firmly targeting high inflation, downside growth risks have escalated.
Market anxiety about the availability of metal supplies has become less intense.
An abnormally strong US dollar remains unusually elevated but the upside momentum appears to have subsided.
Overall, the cyclical guideposts are consistent with ongoing downward pressure on metal raw material prices.
Global Growth - Forecast Revisions
Positive variations in IMF growth forecasts during 2021 have given way to downward revisions as the negative forces detrimentally affecting growth prior to the onset of the COVID-19 pandemic reassert themselves and as emergency policy measures supporting growth are withdrawn.
Overlaying the pre-existing tendency to slower growth is the historically strong surge in global inflation which has caught central banks by surprise and raised the risk of policymakers pushing large parts of the global economy into recession.
The risk of further downward adjustments to global growth forecasts is high.
Forecasters had been warning that global economic growth had begun a lengthy stretch on a lower growth trajectory well before the impact on economic activity of the COVID-19 outbreak.
The expected synchronised growth which had driven
expectations through late 2017 and early 2018 (and which would have been
critical to an impro vement in mining industry fortunes)
had dissipated quickly.
vement in mining industry fortunes)
had dissipated quickly.
The International Monetary Fund confirmed its view, in the October 2018 World Economic Outlook and again in April 2019, that global growth is likely to have reached a peak during the latter part of 2017.
The Fund had cut back its 2019 and 2020 growth forecasts in its October 2019 review of the world economy even before taking account of a COVID-19 impact.
Substantially lower output levels in 2020 were a base for unusually high 2021 global growth outcomes. The momentum of economic activity improved as lockdown measures in the advanced economies were eased. Optimism about the sustainability of economic activity grew as vaccination rates rose
 A
speedy recovery from a dramatic and unforeseen recession surprised many
forecasters, leading to a period of upward growth revisions.
A
speedy recovery from a dramatic and unforeseen recession surprised many
forecasters, leading to a period of upward growth revisions.
Even then, output in many sectors has struggled to match end-2019 levels well into 2022. Geographic disparities in rates of recovery have persisted, reducing the reliability of cross border supply chains, further constraining global growth potential.
Many of the forces which had been adversely affecting growth outcomes prior to 2020 are now combining with increasingly intransigent inflation pressures, making for a policymaking environment more prone to mistakes.
US Dollar Exchange Rate - Chart 2
Over the past 45 years, a 1% fall/rise in the US dollar trade weighted index has come with an average rise/fall of 3% in nonferrous metal prices.
The US dollar has remained elevated for an unusually
prolonged period over recent years after having been on a general downtrend
since the early 1970s.
The currency had moved lower in the year or so after mid May 2020 as evidence mounted that relative interest rates and near term growth performance would not favour the US as much as had been expected.
Along with apparently reduced risks to growth, the weaker U.S. dollar contributed to the upward trajectory in metal prices.
Swings in sentiment about the progress being made in stifling the spread of the COVID-19 virus have added volatility to the currency.
Relatively strong US bond and equity markets
attracted investors to US dollar denominated
 assets. The safe haven status of US assets
has most likely sustained an upward bias to the US
currency, preventing it from reverting to the lower levels from which it had
risen in 2014.
assets. The safe haven status of US assets
has most likely sustained an upward bias to the US
currency, preventing it from reverting to the lower levels from which it had
risen in 2014.
As investors begin to anticipate the end of US monetary tightening, higher non-US interest rates and weaker US equity prices are dampening the upward tendency of the US dollar.
In the years ahead, relatively moderate US growth outcomes and rising US debt are likely to push the currency toward its longer term downward trajectory.
Greater optimism about the overall global growth picture, or a compression of growth differences between the US and other countries, is also likely to take its toll on the currency as capital flows into other countries strengthen.
Longer term trends herald support for US dollar denominated commodity prices, including gold.
International Policy Stance - Charts 3&4
Policy, as it impacts the mining industry, emanates most crucially from central banks but government counter-cyclical fiscal policies and structural initiatives designed to enhance productivity outcomes and facilitate the free flow of trade also play important roles.
Prior to the onset of the COVID-19 pandemic, the US Federal Reserve had flagged it was happy with its policy settings, guiding markets to expect little or no change for the foreseeable future. After January 2020, the Fed moved its policy rate down to near zero and flagged a willingness to aggressively buy corporate securities to stabilise financial markets and shore up asset prices.
Concerted central bank action has supplemented large increases in government spending to mitigate the effects on economic activity of widespread job losses.
Central bank action has helped to prevent a financial crisis by ensuring adequate system liquidity but the impact of easier monetary conditions on the real economy has been limited due to public health measures prohibiting or constraining economic activity.
In the absence of an effect on the real economy, the unprecedentedly strong infusion of global liquidity has helped stoke asset prices, including the prices of those commodities of particular importance to the mining industry.
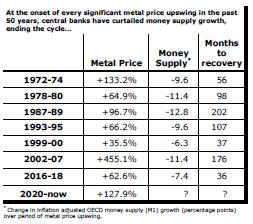
The greatest danger to a metal price cycle comes when monetary policy settings begin to tighten in response to higher inflation with an adverse effect on output growth and investment spending.
In previous cycles, authorities have moved to stem monetary growth rates while metal prices have been on the rise, sometimes quite aggressively, in an effort to prevent the rise of inflation pressures. The tightening in policy has typically cut short price cycles.
A rapid rise in inflationary pressures linked to the conduct of monetary and fiscal policy in the past two years, and exacerbated by the Russian invasion of Ukraine, has led to a dramatic reappraisal of the policy stance, most notable by the US Federal Reserve.
Further interest rate rises into at least the early months of 2023 are now expected making the current metal price cycle look increasingly like those which have occurred in the past and which have been brought to an end by tightening liquidity conditions.
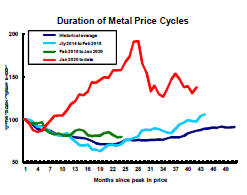
Metal Price Term Structure - Chart 1
The most recent cyclical price strength has coincided with a sharp widening in the spread between near term and future dated metal prices, pointing to growing market anxiety about near term shortages of metal.
 Despite
unusually slow growth in demand for the past several years, inventory
expansion had been limited by slow supply-side reactions, keeping markets close to
balance.
Despite
unusually slow growth in demand for the past several years, inventory
expansion had been limited by slow supply-side reactions, keeping markets close to
balance.
The International Copper Study Group (ICSG) has estimated that copper usage rose by 1.1% in 2021, slightly lower than the 1.4% average rate of growth in the prior six years.
The succession of million tonne-plus increases in annual copper usage during the first decade of the century, requiring new metal making capacity, is not being reproduced.
The International Lead Zinc Study Group is reporting zinc usage this year running below 2017 rates even after a relatively large 5.7% rise in 2021.
Some part of the constraints on the supply side have been involuntary
insofar as permitting times have blown out and development finance has been hard to access. Especially in
the case of zinc, mine closures due to mineral exhaustion have had an
effect.
access. Especially in
the case of zinc, mine closures due to mineral exhaustion have had an
effect.
Some other production cuts can be reversed in the event demand growth accelerates.
The pipeline of development properties has begun to grow more strongly, leaving markets likely to experience a stronger flow of metal in coming years.
Depending on the severity of COVID-19 usage constraints, inventory building could recommence during 2022 and for a year or two after without changes to current production intentions.
Chinese Growth Momentum - Chart 5
The momentum of Chinese economic activity has slackened significantly as pandemic restrictions have impacted manufacturing and global trade flows have slowed.
Chinese growth was destined to head lower in coming years,
in any case, although China has consistently met annual statistical goals through periodic growth surges,
when necessary, stalling the inevitable.

Successive quarterly growth outcomes of 1.2% in the second and third quarters of 2019 were the slowest rates in a decade, pointing more conclusively to a permanent downward shift in the momentum of economic activity.
In the absence of market reforms comparable in importance to those which have occurred historically, the sensitivity of growth to monetary and fiscal policy changes in China has been falling.
The restructuring of the Chinese economy with a resulting contraction in the contribution to Chinese GDP of investment spending would have had a generally detrimental effect on raw material demand.
Signs of subdued Chinese investment momentum have been evident in statistics released by the International Copper Study Group and the International Lead Zinc Study Group which have shown unusually weak growth in metal use over the past several years.
A strong recovery through the second half of 2020 will have meant China had one of the smallest output contractions of any country due to the COVID-19 pandemic.
Although China's economy had appeared to be among the most resilient in the face of the COVID-19 threat, its more recent performance has shown that its COVID containment policies have come with ongoing economic costs while the rest of the world has moved closer to normal rates of output.
A reversion to the rate of expansion evident prior to the COVID-19 outbreak implies a deceleration in annual growth to 4-5% with considerably lessened chances of China providing the mining industry with the periodic surges in demand which have contributed to the tighter market conditions than would have otherwise prevailed.