The Current View
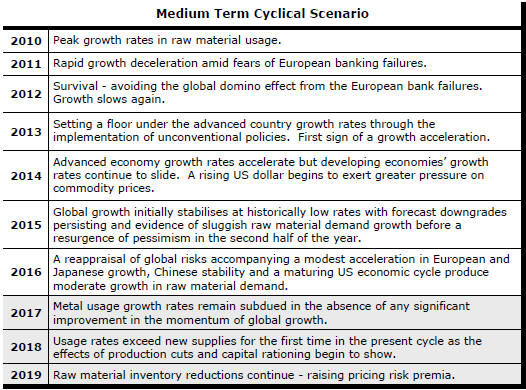
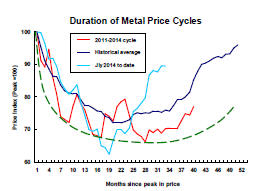
Growth in demand for raw materials peaked in late 2010. Since then, supply growth has generally outstripped demand leading to inventory rebuilding or spare production capacity. With the risk of shortages greatly reduced, prices lost their risk premia and have been tending toward marginal production costs to rebalance markets.
The missing ingredient for a move to the next phase of the cycle is an acceleration in global output growth which boosts raw material demand by enough to stabilise metal inventories or utilise excess capacity.
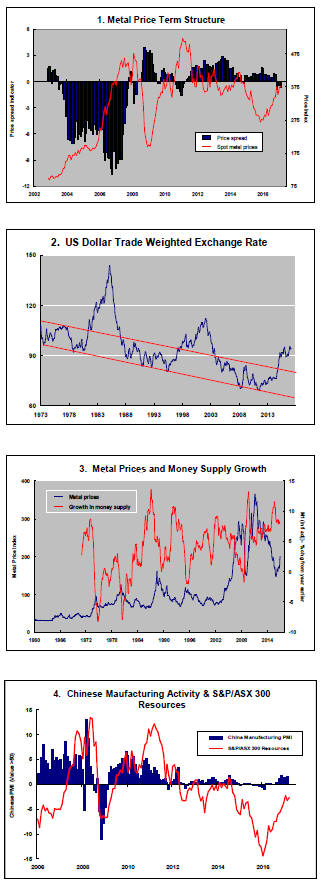
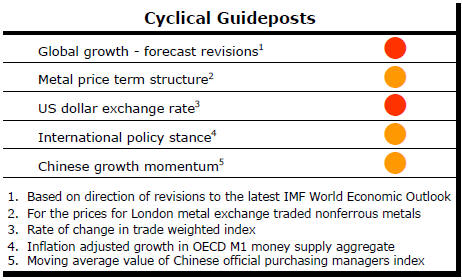
The PortfolioDirect cyclical
guideposts suggest that the best possible macroeconomic circumstances for
the resources sector will involve a sequence of upward revisions to
global growth forecasts, the term structure of metal prices once again
reflecting rising near term shortages, a weakening US dollar, strong money
supply growth rates and positive Chinese growth momentum. None of the five guideposts is "set to green"
(after the most recent adjustments in December 2016) suggesting the sector remains confined
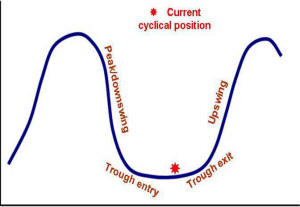
to near the bottom of the cycle.
Has Anything Changed? - Updated View
From mid 2014, the metal market cyclical position was characterised as ‘Trough Entry’ with all but one of the PortfolioDirect cyclical guideposts - the international policy stance - flashing ‘red’ to indicate the absence of support.
Through February 2016, the first signs of cyclical improvement in nearly two years started to emerge. The metal price term structure reflected some moderate tightening in market conditions and the guidepost indicator was upgraded to ‘amber’ pending confirmation of further movement in this direction.
As of early December 2016, the Chinese growth momentum indicator was also upgraded to amber reflecting some slight improvement in the reading from the manufacturing sector purchasing managers index. Offsetting this benefit, to some extent, the policy stance indicator has been downgraded from green to amber. While monetary conditions remain broadly supportive, the momentum of growth in money supply is slackening while further constraints on fiscal, regulatory and trade regimes become evident.
Fed Rate Rises Jeopardise Mining Cycle
A resources industry cycle could be stifled for several years as the Federal
Reserve pursues policy normalisation.
The U.S. Federal Reserve has commenced pushing interest
rates toward their longer term target in a concerted way for the first time
since interest rates were dropped to their lower bound in 2009.
The FOMC has raised the Federal Funds rate on two prior occasions before the rise last week but, both times, the move was hesitant and, after a rise in December 2015, not repeated for another 12 months.
In discussing the policy change, Fed chair Janet Yellen observed that the Fed Funds neutral rate was now lower than has historically been the case but also made it very clear that she and her colleagues expected a prolonged series of rises to reach the neutral position.
Fed policy participants are saying there could be three rises in 2017 and another three in 2018.
Higher interest rates would be followed by a contraction in the size of the Fed balance sheet which grew as the bank intervened in financial markets to purchase securities.
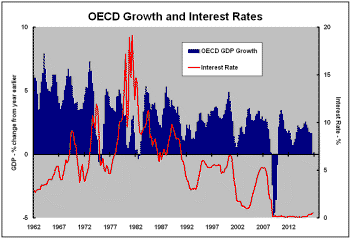
Over the past 50 years, a rising cycle of rates has not got underway while global growth has been as low as it currently is. Nor have rates started to rise while global growth has been slowing.
When rates have begun to rise, growth has been unusually strong and policy changes have been used to engineer a slowdown.
A turn in the interest rate cycle would normally coincide with good times for the mining industry but not on this occasion.
The growth picture is vitally important for the prosperity of the mining industry. Demand for mine output grows most quickly in the acceleration phase of the economic cycle and is highly leveraged to any slowdown.
If history is replicated, a cycle of rate rises would initiate a decline in the rate of global output growth. Raw material demand would, consequently, grow less quickly and, depending on the speed of the slowdown, possibly contract.
Slowing demand for mine output is likely to result in inventory accumulation especially since demand growth is already running below historical rates. Lower metal prices would ensue.
To the extent that higher U.S. interest rates contributed to a stronger U.S. dollar exchange rate, the downward pressure on metal prices would intensify.
How much of a policy tightening the U.S. economy can withstand before growth is affected adversely remains uncertain.
As usual, the Fed is emphasising that subsequent moves will be data dependent but, for the time being, the central bank appears intent on getting rates back to normal.
While the policy settings will most directly affect, and are in response to, economic outcomes in the USA, the external effects of its policies could become highly material for the mining industry. Widening interest differentials may affect capital flows and cause economic dislocation in emerging markets.
Of course, it is not the primary intention of the Federal Reserve to impact growth but, as in earlier cycles, negative effects on activity are the way in which central banks temper inflation pressures.
The Fed has emphasised, in kicking off the interest rate normalisation process, that further rises will be very gradual. This will be an important difference with how rate rises have occurred in the past.
Most often, policymakers have feared losing control and have reacted with more vigour than would have otherwise been needed. The speed of policy shift has damaged economic activity and contributed adversely to resources industry cyclical conditions.
On this occasion, the Fed is working within a relatively benign framework. In pushing interest rates higher, the Fed is looking for more policy flexibility rather than trying to avert an imminent problem.
Right now, the Fed lacks the monetary firepower to respond to a cyclical slowdown in growth insofar as it is already so close to the lower bound of feasible interest rates.
In signalling explicitly their preferred pace of policy change, FOMC members will be hoping that their impact on growth outcomes will be minimised while keeping a lid on inflation expectations and improving their longer term policy flexibility.
An important element in the current policy mix is the scope for productivity improvements. U.S. productivity is plumbing new depths in part because of the greater importance of services to U.S. economic activity.
One of the benefits of the commitment to increased spending on infrastructure by the Trump administration is the potentially favourable impact on national productivity.
Stronger productivity growth will enable stronger wages growth. With employment incomes accounting for over half of U.S. GDP, they are an important force for improved global growth as well as a source of higher U.S. output growth rates.
Anticipated tax cuts in the U.S. could also be expected to spur growth through higher investment spending.
So, this cycle is very different. By historical standards, interest rates are beginning to rise prematurely and contrary to the fortunes of the resources industry.
With luck, the Fed may have been conveniently sidelined by what is happening on the fiscal side of the US policy process.
Rate rises may be so gradual as to be nearly irrelevant to spending decisions more affected by government investment, lower taxes and lowered regulatory burdens.
But any delay in implementing policies such as lower corporate tax rates or disappointment over their coverage could affect investment and growth outcomes detrimentally
This combination has never happened before but nor have policy settings been tilted so markedly in one direction.
The best course for the resources industry would have been for the interest rate cycle to be on the way down as fiscal expansion loomed. Then, policy would have been unambiguously propelling the cycle.
The inference from the current mix of policies is less clear cut but does suggest taking a cautious view about the speed of any building cyclical pressures.