The Current View
Growth in demand for raw materials peaked in late 2010. Since then, supply growth has generally outstripped demand leading to inventory rebuilding or spare production capacity. With the risk of shortages greatly reduced, prices lost their risk premia and have been tending toward marginal production costs to rebalance markets.
The missing ingredient for a move to the next phase of the cycle is an acceleration in global output growth which boosts raw material demand by enough to stabilise metal inventories or utilise excess capacity.
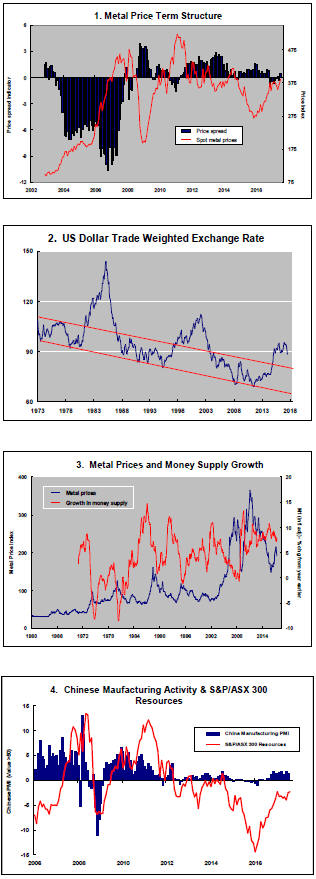
The PortfolioDirect cyclical
guideposts suggest that the best possible macroeconomic circumstances for
the resources sector will involve a sequence of upward revisions to
global growth forecasts, the term structure of metal prices once again
reflecting rising near term shortages, a weakening US dollar, strong money
supply growth rates and positive Chinese growth momentum. Only one of the five guideposts is "set to green"
(after the most recent adjustments in July 2017) suggesting the sector remains confined
to near the bottom of the cycle.

Has Anything Changed? - Updated View
From mid 2014, the metal market cyclical position was characterised as ‘Trough Entry’ with all but one of the PortfolioDirect cyclical guideposts - the international policy stance - flashing ‘red’ to indicate the absence of support.
Through February 2016, the first signs of cyclical improvement in nearly two years started to emerge. The metal price term structure reflected some moderate tightening in market conditions and the guidepost indicator was upgraded to ‘amber’ pending confirmation of further movement in this direction.
As of early December 2016, the Chinese growth momentum indicator was also upgraded to amber reflecting some slight improvement in the reading from the manufacturing sector purchasing managers index. Offsetting this benefit, to some extent, the policy stance indicator was been downgraded from green to amber.
The most recent change in cyclical guidepost positioning has been at the end of July 2017 when the exchange rate guidepost was upgraded to green.
Aluminium Point to Lithium Future
Aluminium may provide a guide to how the lithium market evolves.
Advocates of lithium-related investments hang their enthusiasm on rapid electrification of motor vehicles.
Ken Brinsden, the chief executive of one of the leading new entrants into the lithium mining space, recently took 15 pages out of a 33 page Pilbara Minerals presentation to put the case for a dramatic increase in the size of the lithium market.
Brinsden told investors to expect a 10 year demand growth rate of 23-33% a year.
On this point, Brinsden and others are likely right. Motor vehicle manufacturers are not only embracing electrification but lithium-ion batteries are the only energy storage solution with commercial appeal presently.
On several other points relevant to investment outcomes, the lithium zealots are mistaken or at least guilty of exaggerating the potential.
Their advocacy contains an unstated assumption that metals with the most strongly growing demand profiles are likely to offer the best investment prospects.
They continue a long industry tradition of naively
forecasting future lithium prices, or the prices of any other metals, by
extrapolating what has happened in the past six or twelve months.

The connection between the demand for lithium and its price mostly goes unexplored as charts showing demand outstripping supply are used to titillate investors.
The market imbalance argument comes from an extension of the traditional approach to forecasting prices for metals like copper and zinc.
The major daily traded non-ferrous metals have a history of commercial production extending back centuries. In the event short term demand exceeds current production, the shortfall can be drawn from accumulated inventories or secondary supplies.
Without a historical accumulation of inventories, the amount of lithium used cannot exceed current production.
These analytical misperceptions arise partly from wishful thinking but also come in the absence of recent experiences from which to infer an alternative forecasting framework.
The closest parallel is what happened to the aluminium market.
Aluminium is the newest of the major non-ferrous metals. Commercial production of aluminium was enabled by technical breakthroughs in the late nineteenth century.
The U.S. Geological Survey has estimated that only 6,800 tonnes of aluminium were produced world-wide in 1900. Over the succeeding 15 years, usage grew by an average 20% a year, akin to the expected growth from lithium over the coming decade.
In its own way, aluminium revolutionised transport and packaging options by offering a strong, lightweight alternative material with attractive recyclable properties. It remains at the leading edge of materials technology innovation.
Growth in aluminium usage has continued to outstrip the use of other mining products.
Since 1990, aluminium usage has grown at a 4.7% annual pace. Copper, zinc and nickel demand growth rates have ranged between 2.8% and 3.1%.
Over the same time frame, aluminium prices increased by less than the prices for 10 of the main mining products including uranium, coal, iron ore and the major non-ferrous daily traded metals.
The average aluminium metal price of US$1,604/tonne in 2016 compares with an inflation adjusted price of US$14,430/tonne in 1900 and a 1900-05 average of $14,310/tonne.
The highest aluminium metal prices over the past 120 years occurred in the first few years of the twentieth century just as production of the new metal was getting underway.
Statistically, aluminium prices remain on a downward price trend which has remained remarkably consistent over more than a century.
As with aluminium, high prices for lithium in the early stages of its adoption are providing the necessary market signalling to attract funding for new production capacity.
 Lithium
is also similar to aluminium in that mineral supplies are plentiful and
readily accessible.
Lithium
is also similar to aluminium in that mineral supplies are plentiful and
readily accessible.
If lithium was to echo the course of the aluminium market, one would expect to see lithium prices near their peak presently.
A long term downward trend in lithium prices is consistent with future lithium demand being at least as strong as currently expected, based on the aluminium experience.
The longer term evolution of prices has implications for corporate strategic positioning. Overly rosy expectations have given many company directors a mistaken impression about their choices.
Jumping on the lithium bandwagon in the near term has given smaller companies in the sector an easier route to raising capital comprehensively skewing strategic decisions in one direction.
The Kidman Resources chief executive, for example, had been adamant in mid-2015 that the company would remain focused on gold and look for alternative ways to realise the value from its recently unveiled and previously unanticipated lithium prospects.
The company, cheered on by many investors, has ended up embracing lithium as the mainstay of its development strategy and looking for ways to jettison its gold exposures.
Other companies are looking to switch from zinc, copper and iron ore as they prioritise near term capital raising efforts.
To the extent the aluminium parallel plays out, all of these companies will face a falling lithium price trend and a demand profile increasingly correlated with shifts in world wide economic activity.
Gold producers making the switch to lithium may have an especially regret-filled future.
Gold offers advantages with which lithium is unlikely to compete.
As a unique monetary asset, gold cannot price itself out of the market. Redundancy or obsolescence risk is low. The internal diversification properties of gold offer attractive risk management characteristics.
Gold prices benefit from rising wealth effects as well as from instability in the prices of non-gold financial assets including during periods of weakening demand for industrial materials and durable consumer goods on which the fortunes of lithium producers will rely.
More broadly, investments in metals such as zinc, copper, nickel and even aluminium will have one outstanding investment advantage over lithium.
The best established metals will have moved well beyond the early stage adjustment confronting lithium and characterised by a halving of aluminium prices in the early years of the metal’s industrial ascendency.