The Current View
Growth in demand for raw materials peaked in late 2010. Since then, supply growth has generally outstripped demand leading to inventory rebuilding or spare production capacity. With the risk of shortages greatly reduced, prices lost their risk premia and have been tending toward marginal production costs to rebalance markets.
The missing ingredient for a move to the next phase of the cycle is an acceleration in global output growth which boosts raw material demand by enough to stabilise metal inventories or utilise excess capacity.
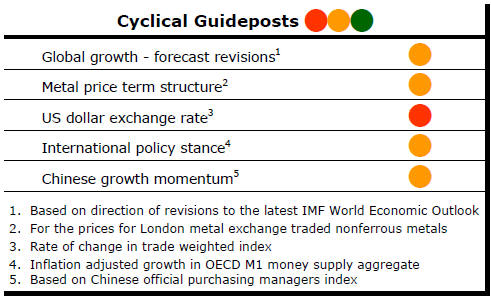
The PortfolioDirect cyclical
guideposts suggest that the best possible macroeconomic circumstances for
the resources sector will involve a sequence of upward revisions to
global growth forecasts, the term structure of metal prices once again
reflecting rising near term shortages, a weakening US dollar, strong money
supply growth rates and positive Chinese growth momentum. None of the five guideposts is "set to green"
(after the most recent adjustments in December 2016) suggesting the sector remains confined
to near the bottom of the cycle.
Has Anything Changed? - Updated View
From mid 2014, the metal market cyclical position was characterised as ‘Trough Entry’ with all but one of the PortfolioDirect cyclical guideposts - the international policy stance - flashing ‘red’ to indicate the absence of support.
Through February 2016, the first signs of cyclical improvement in nearly two years started to emerge. The metal price term structure reflected some moderate tightening in market conditions and the guidepost indicator was upgraded to ‘amber’ pending confirmation of further movement in this direction.
As of early December 2016, the Chinese growth momentum indicator was also upgraded to amber reflecting some slight improvement in the reading from the manufacturing sector purchasing managers index. Offsetting this benefit, to some extent, the policy stance indicator has been downgraded from green to amber. While monetary conditions remain broadly supportive, the momentum of growth in money supply is slackening while further constraints on fiscal, regulatory and trade regimes become evident.
Market Seasonality
The resources segment of the Australian equity market
displays a marked seasonal pattern.

The month of June is typically weak as the end of the financial year approaches for individual taxpayers. The move to tidy up tax affairs tends to encourage selling those stocks where losses exist.
Tax loss selling disproportionately affects smaller listed companies and those with lower levels of share turnover.
The flip side of weakness in June is a tendency for prices to recover in July.
So far during June 2017, the small resources share price index has declined 3.0%. The PortfolioDirect index tracking 50 exploration companies has lost 5.5%.
Industry Profitability and Investment
Data in the March quarter national accounts from the Australian Bureau
of Statistics show the extent to which the Australian mining industry is
leveraged to improved commodity market conditions. 
The ABS reported that sector profits before tax rose by 311% over the December 2016 and March 2017 quarters.
The $13 billion increase in quarterly profits took them to within 15% of peak profits for the industry in 2011.
Improved iron ore and coal prices are at the heart of the profit surge.
Meanwhile, the ABS data also showed a further decline in the amount of investment being undertaken by the industry in Australia.
Including exploration, spending fell to $43.1 billion over the 12 months ended March 2017.
As the chart
illustrates, industry spending is running at some $60 billion a year below
the rate at the peak of the cycle.

The improved profitability, if sustained, would be equivalent to an extra $52 billion a year offering some relief for the Australian economy from the investment decline.
Unfortunately, the macro impacts of investment spending far outweigh the dollar value of profits although higher profits will help governments to paper over some shortfalls in taxation receipts.
The rapid movement in profits is also a warning sign about volatility for governments prone to talk about four year and 10 year policy impacts. They will face very large swings in quarterly tax collections as these volatile commodity market conditions prevail leaving revenue projections more susceptible to error and uncertainty.


