The Current View
A lengthy downtrend in sector prices had given way to a relatively stable trajectory after mid 2013 similar to that experienced in the latter part of the 1990s and first few years of the 2000s.
The late 1990s and early 2000s was a period of macroeconomic upheaval during which time sector pricing nonetheless proved relatively stable.
Relative stability suggests a chance for companies genuinely adding value through development success to see their share prices move higher. This was the experience in the late 1990s and early 2000s.
Still vulnerable cyclical conditions were aggravated in the second half of 2015 by a push from investors worldwide to reduce risk. Sector prices were pushed to a new cyclical low. These conditions were largely reversed through the first half of 2016 although sector prices have done little more than revert to mid-2015 levels.
With a median decline in prices of ASX-listed resources companies through the cycle of 89%(and 30% of companies suffering a decline of more then 95%), the majority of stocks remain prone to strong 'bottom of the cycle' leverage in response to even slight improvements in conditions.
Has Anything Changed?
A 1990s scenario remains the closest historical parallel although the strength of the US dollar exchange rate since mid 2014 has added an unusual weight to US dollar prices.
The first signs of cyclical stabilisation in sector equity prices have started to show. This has meant some very strong ‘bottom of the cycle’ gains.
Funding for project development may have passed its most difficult phase at the end of 2015 with signs of deals being done and evidence that capital is available for suitably structured transactions.
Key Outcomes in the Past Week
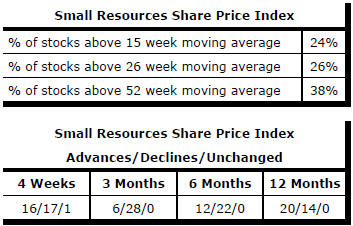
Market Breadth Statistics

U.S. equity markets continue to hit new records even as underlying corporate profits remain stalled.
The U.S. government has released its estimate of after
tax corporate profits in the March quarter of 2017. Profits fell slightly in
the quarter (-0.3%) but had already recovered strongly from a year earlier.
The increase over the 12 months ended March 2017 was 12.0%.
The pattern of profit growth in the national accounts was similar to the track of S&P 500 company profits which increased by 19.2% from a year earlier after a rise of 3.8% in the March quarter. Profit from the larger companies with more internationally oriented sales would have benefitted from lower currency outcomes through the first quarter of 2017.
S&P 500 company profits in the latest quarter remained 5.2% below peak profit for the index stocks which occurred in the September quarter of 2014.
National accounts profits had peaked in the December quarter of 2014 and remained lower in the latest quarter. The most recent reading of profits was little different to the level as far back as the March quarter of 2012.
The absence of meaningful profit growth over five years seems flimsy ground on which to rest the 67% rise in the Russell 2000 and S&P 500 share price indices over the same period.
Having markets set new records during a period without profit growth is not unprecedented. It also happened between 1996 and 2000.
On that earlier occasion, profits and markets were eventually realigned by a collapse in equity prices while profits made a dramatic recovery.
The more recent market performance has been accompanied by historically low bond yields which would have at least partly validated the rise in market prices.
Looking ahead, bond yields, even if not rising further, may change little. Without this support, market momentum will rely increasingly on more robust growth in profits.
Standard & Poor’s is currently forecasting that S&P 500 earnings will grow by 16% over the coming 12 months although such forecasts are invariably revised down as the time to report each quarter draws nearer.
With short term interest rates on the rise in the year ahead, equity prices will be under pressure even with the currently forecast increase in earnings.
Alternatively, markets may be assuming correctly a less
aggressive stance by the Federal Reserve than that implied by the expected
three Federal Funds rate rises in 2017 followed by a similar pace of
adjustment in 2018 accompanied by a rundown in holdings of central bank
securities.

Markets are also facing several individual sector headwinds. Energy stocks are fighting a weak oil market. Temporary rises in oil prices engineered by OPEC production cuts are attracting fresh U.S. production limiting the extent to which the oil market is adjusting to current levels of demand.
The financial sector has shown lower returns (+2% during 2017 to date) with emerging doubts about the effectiveness of the new U.S. administration in meeting its goals of cutting regulation and reducing taxes.
From the perspective of bank stocks as well as industrial companies more generally, an unexpectedly comprehensive and speedy implementation of tax reform may be needed to sustain market enthusiasm.
Meanwhile, markets are being held aloft by the performance of a relatively small number of high profile technology companies which have acquired disproportionately large index weightings. Their capacity to disrupt other industries (e.g. retail stores and banks) reflects some of the relative performance but markets are now vulnerable to them not fulfilling expectations or failing to execute as perfectly as their pricing suggests.
Over the year to date, the S&P 500 information technology sector has added 20% while the energy component has declined 12%.
.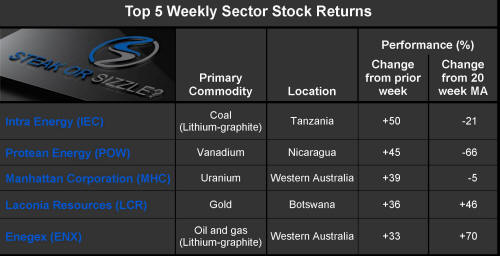
The Steak or Sizzle? blog LINK contains additional commentary on the best performed stocks in the sector and the extent to which their investment outcomes are underpinned by a strong enough value proposition to sustain the gains.
