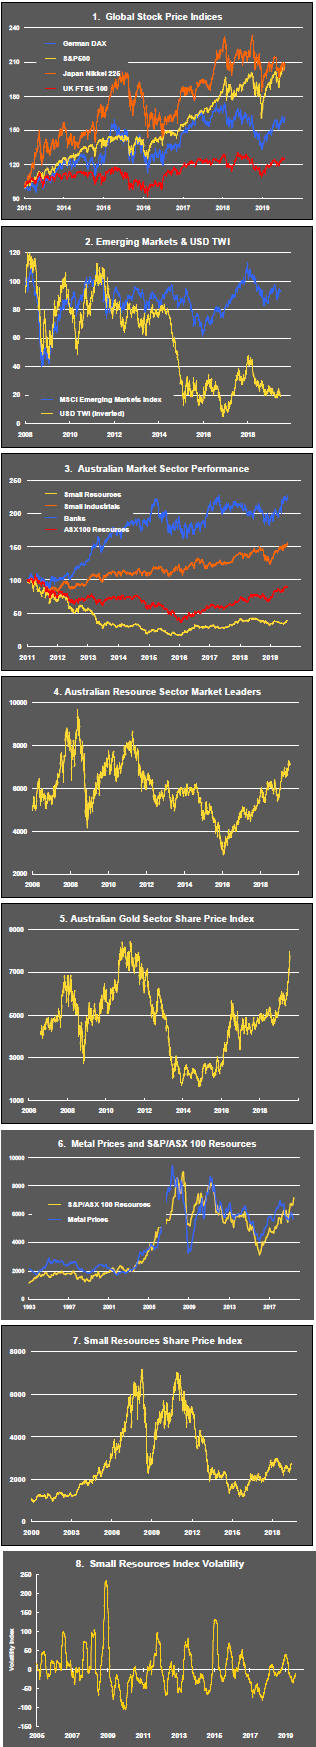
The Big Picture
After recovering through 2010, a lengthy downtrend in sector prices between 2011 and 2015 gave way to a relatively stable trajectory similar to that experienced in the latter part of the 1990s and first few years of the 2000s.

The late 1990s and early 2000s was a period of frequent macroeconomic upheaval during which time sector pricing nonetheless proved relatively stable.
Relative stability in sector prices suggests a chance for individual companies genuinely adding value through development success to see their share prices move higher. This was the experience in the late 1990s and early 2000s.
Still vulnerable cyclical conditions were aggravated in the second half of 2015 by a push from investors worldwide to reduce risk. Sector prices were pushed to a new cyclical low some 90 months after the cyclical peak in sector equity prices but these conditions were reversed through 2016 and 2017 although, for the most part, sector prices have done little more than revert to the 2013 levels which had once been regarded as cyclically weak.
With a median decline in prices of ASX-listed resources companies through the cycle of 89%(and 30% of companies suffering a decline of more then 95%), the majority of stocks remain prone to strong 'bottom of the cycle' leverage in response to even slight improvements in conditions.
In the absence of a market force equivalent to the industrialisation of China, which precipitated an upward break in prices in the early 2000s, a moderate upward drift in sector equity prices over the medium term is likely to persist.
The Past Week
US equity markets continued to set records as expectations of an imminent cut in interest rates solidified.
Market expectations seemed to coalesce around not just one but several Federal Funds rate reductions over the balance of 2019, with more through 2020.
Views about interest rate movements seemed divorced from the flow of data about the state of the US economy. GDP estimates for the second quarter of 2019 pointed to slower growth than a year earlier but a pace consistent with an ongoing expansion led by buoyant consumer confidence, greater job security and rising incomes.
Key points of weakness in manufacturing output and business investment remained evident.
The profile of the global economy was highlighted by an update from the International Monetary Fund (IMF). The Fund emphasised the downside risks in cutting its forecasts for 2019 and 2020 by a small, but highly symbolic, 0.1 percentage points.
In explaining its forecast changes, the IMF pointed to the risks arising from the ongoing dispute between China and the USA over trade. The determination of the new British prime minister to exit the European Union was also reckoned to disrupt global supply chains and curtail business investment.
The US President, during an impromptu gaggle in the Oval Office with reporters, appeared keen to lower expectations of a breakthrough on the trade front and even opened a new front with Europe with the threat of a tax on French wine in retaliation for tax proposals directed at curbing the influence of, predominantly US based, social media platforms.
Trump also spoke about wishing to see US interest rates lowered so as to establish an even playing field with Europe and China for US business. Inferences that Trump was urging a weaker US dollar were denied by staff although they also confirmed reports that a presentation had been made to the president about how capital controls could be used to manage the dollar lower.
The US dollar has been on a gradually rising trend and regained some recently lost ground in the past week despite expectations of a lowered Fed Funds target. The direction of the currency poses a threat to US corporate earnings growth generally as well as to the levels of US dollar denominated commodity prices.
Yields on US and European bonds retained their downward bias amid expectations of further slowing in global growth.
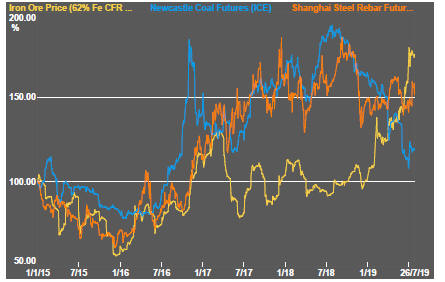
Global mining sector equity indicators were edging lower by the end of the week albeit from heightened levels enhanced recently by the combination of generally strong US equity prices and the highest iron ore prices in several years.
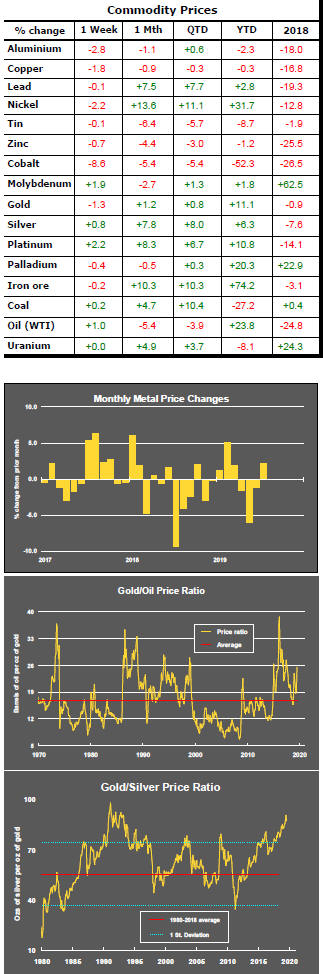
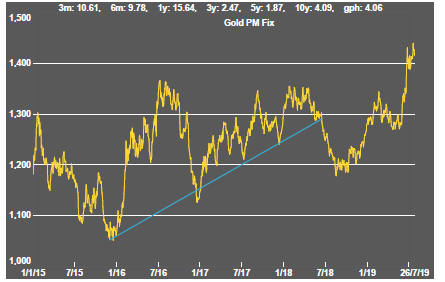
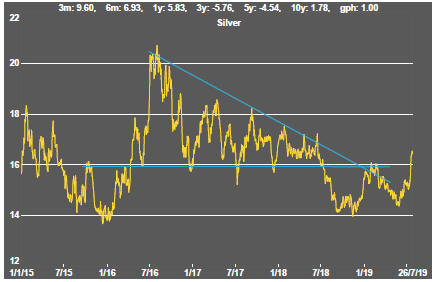
Gold bullion prices remained near the highest levels in five years while silver prices finally began to outperform after having lagged gold price rises by a historically large margin. The price of gold bullion appears heavily reliant on movements in financial market relative prices and, in particular, continuing falls in bond yields.
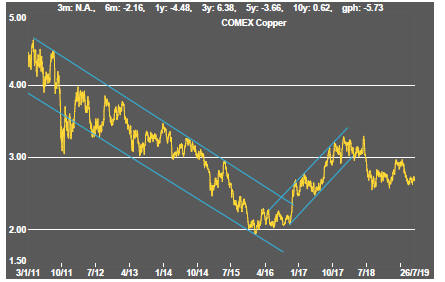
Daily traded nonferrous metal prices all tended lower during the week although moves were mostly moderate. The copper price, usually a key activity indicator, remained consistent with there being no evident improvement in global activity rates.
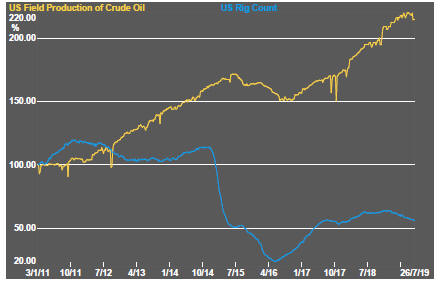
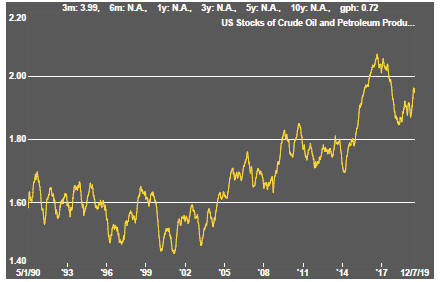
Crude oil prices edged higher but the related prices of oil and gas exploration and production companies once again declined as they continued to underperform the prices of crude oil.
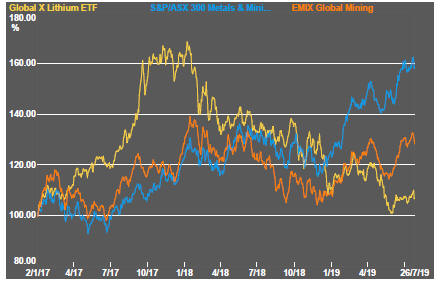
The battery metals segment retained its downside bias as did uranium exposed companies. In neither case have users of the metals displayed as much anxiety about future product availability as miners claim they should be feeling.
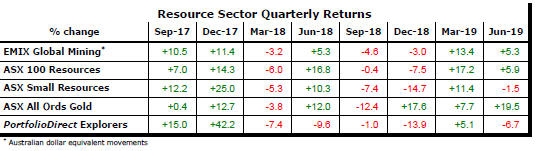
Sector Price Outcomes

52 Week Price Ranges

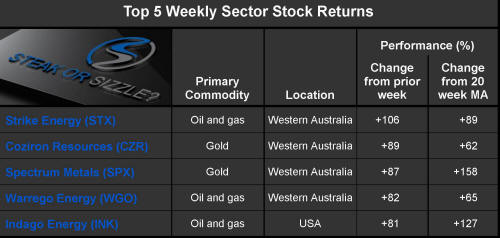
The Steak or Sizzle? blog LINK contains additional commentary on the best performed stocks in the sector and the extent to which their investment outcomes are underpinned by a strong enough value proposition to sustain the gains.
Equity Market Conditions


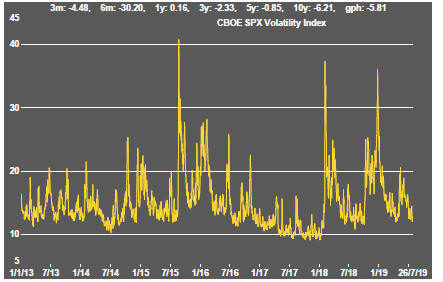
Resource Sector Equities


Interest Rates


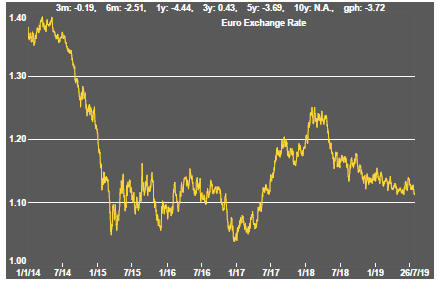
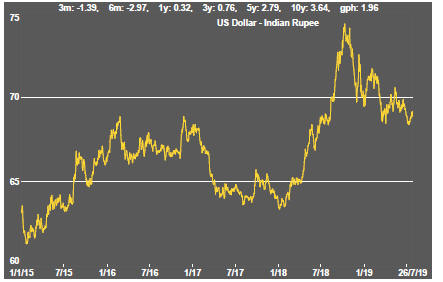
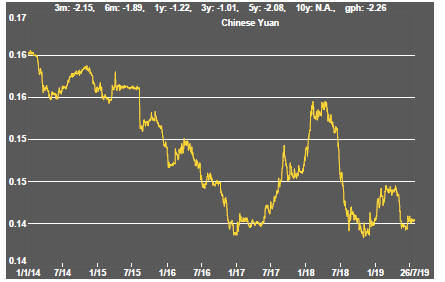
Exchange Rates


Commodity Prices Trends

Gold & Precious Metals


Nonferrous Metals


Bulk Commodities
Oil and Gas

Battery Metals


Uranium