The Current View
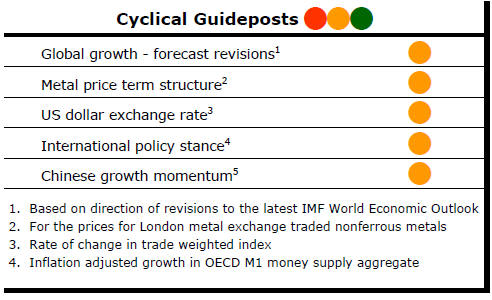
The PortfolioDirect cyclical guideposts suggest that the best possible macroeconomic circumstances for the resources sector will involve a sequence of upward revisions to global growth forecasts, the term structure of metal prices once again reflecting rising near term shortages, a weakening US dollar, strong money supply growth rates and positive Chinese growth momentum.
All of the five guideposts are "flashing amber" with the potential for at least one to switch to red shortly suggesting the cycle is now struggling to make headway.
Has Anything Changed? - Updated View
From mid 2014, the metal market cyclical position was characterised as ‘Trough Entry’ with all but one of the PortfolioDirect cyclical guideposts - the international policy stance - flashing ‘red’ to indicate the absence of support.
Through February 2016, the first signs of cyclical improvement in nearly two years started to emerge. The metal price term structure reflected some moderate tightening in market conditions and the guidepost indicator was upgraded to ‘amber’ pending confirmation of further movement in this direction.
As of early December 2016, the Chinese growth momentum indicator was also upgraded to amber reflecting some slight improvement in the reading from the manufacturing sector purchasing managers index. Offsetting this benefit, to some extent, the policy stance indicator was downgraded from green to amber.
At the end of July 2017, the exchange rate guidepost was upgraded to green.
As 2017 ended, there were emerging signs of economic forecasters beginning a sequence of growth forecast upgrades prompting a revision of the global growth guidepost to "green".
Three quarters of the way through 2018, global growth appears to have peaked and the US dollar is on the rise both warranting guidepost downgrades.
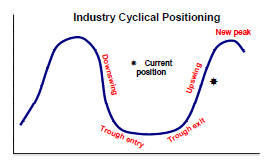
Cyclical Position
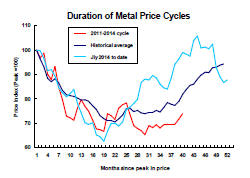
The level and direction of metal prices are consistent with the historical average this far into a cycle. A more detailed analysis of metal price cyclical duration is available here.
Time, of itself, is not important but the sequence of adjustments which are typical of a commodity price cycle and contribute to changed prices and expectations does take time.
The question now is whether there is enough momentum to carry the industry through a more prolonged upswing phase of the cycle. More often than not, progress stalls around this point.
A pullback is not a necessary outcome but an alternative result would most likely require some combination of higher global growth than currently anticipated, U.S. dollar weakness or more supportive monetary policies. Each of these three key influences is moving through a transitional phase with none currently pointing in the right direction.
Global Growth - Forecast Revisions
Forecasters are flashing warning signs that global economic growth might has begun a downward slide.
The International Monetary Fund has confirmed its view, in the October World Economic Outlook, that global growth is likely to have reached a peak during the latter part of 2017.
The Fund downgraded its growth forecast for 2018 and
2019. The change is important symbolically, even if within the bounds
of forecasting error, insofar as it signals emerging disappointment about
the outlook and a need for a change in expectations.
Upbeat assessments of the world economy had relied heavily on an extrapolation of what had happened in late 2017.
Global growth accelerated in 2017 from 3.2% to 3.8%, the strongest increase since the recovery from the financial crisis during 2010. Improving growth outcomes in the second half of 2017 underpinned rising metal usage following an otherwise lacklustre first half.
The strongest increases in metal usage typically occur when global GDP growth is accelerating.
From an equity market perspective, rising growth projections are usually a prompt for strategists to raise sectoral fund allocations.
The expected synchronised growth which had driven expectations through late 2017 and early 2018 (and which would have been critical to an improvement in mining industry fortunes) appears to have dissipated quickly.
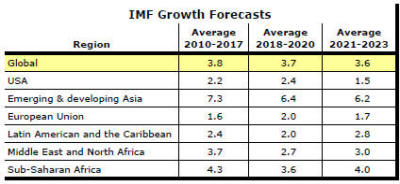 The
IMF analysis points to average growth rates in the next six
years being less than in the last six years. Key regions of the world – the USA,
Europe and emerging Asia – face a downward trending growth outlook.
The
IMF analysis points to average growth rates in the next six
years being less than in the last six years. Key regions of the world – the USA,
Europe and emerging Asia – face a downward trending growth outlook.
Unusually low productivity growth in most advanced economies, reflecting low business investment spending and governments with little enthusiasm for reform agendas, are constraining how quickly global output can expand.
Legislation to cut taxes in the USA has added a near term fiscal stimulus but whether tax cuts support productivity enhancing capital spending in the next several years to sustain a stronger growth base is less certain.
Meanwhile, a threatened departure from the trade liberalisation forces of the past several decades precipitated by the US administration seeking to capture a larger share of world trade endangers global growth prospects and, ultimately, the prosperity of the mining industry.
Whatever the eventual outcome of the recent threats and counter threats over trade, the resulting uncertainties, left to fester, will retard business investment plans. Signs of this are already evident.
The most important missing piece in the progress of the metal price cycle – a stronger private sector investment commitment – is at risk immediately whatever the eventual impact on trade flows.
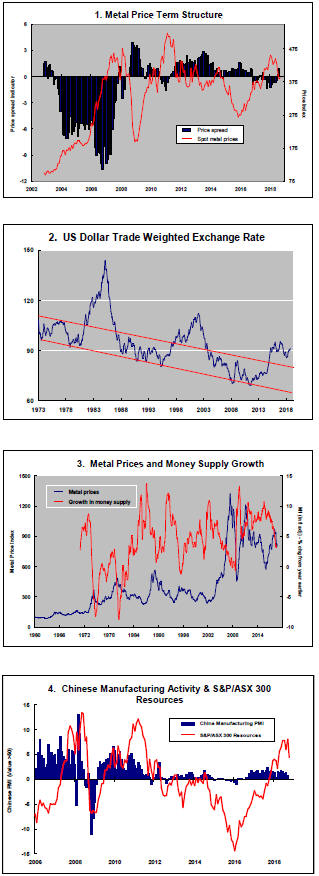
US Dollar Exchange Rate - Chart 2
Along with reduced risks to growth, a weaker U.S. dollar contributed to the upward trajectory in metal prices through 2017.
Over the past 45 years, a 1% fall in the US dollar trade
weighted index has come with an average rise of 3% in nonferrous metal prices.
The downward currency adjustment had reflected some reappraisal of relative growth rates, with more optimism about Europe, and the direction and pace of interest rate changes.
Diminished financial stability risks in Europe favoured the euro.
The
reduced need in a less risky macro
Some of these factors are now being unwound, at least temporarily.
European growth has lost momentum and attention is again focusing on the likelihood of US interest rate changes running ahead of moves in Europe.
F altering emerging economies have also made investors more sceptical about
their growth prospects. Higher US interest rates which have raised
debt serving obligations have added to the currency woes.
altering emerging economies have also made investors more sceptical about
their growth prospects. Higher US interest rates which have raised
debt serving obligations have added to the currency woes.
Stronger US growth from a tax and spending driven fiscal stimulus may also contribute to a near term reappraisal of economic conditions in favour of the US dollar although US policies are not a sustainable source of upward currency pressure without structural changes to US growth potential.
Some of these forces are temporary. In the years ahead, as distinct from the balance of 2018, slower US growth than in 2018 and rising US debt are likely to drag the currency toward its longer term downward trajectory.
International Policy Stance - Chart 3
Global monetary policies had been set so as to support higher asset prices as a step toward raising demand and creating stronger employment markets. Commodity prices benefitted from the stronger liquidity flows into speculative markets as well as improvements in real output growth.
As some of the most favourable monetary conditions in modern history are wound back, the mining industry will be relying more heavily on output growth alone and, for that, on the willingness of governments to foster stronger productivity outcomes to raise global growth potential.
Stronger productivity growth will facilitate increases in wages and consumer spending with fewer worries about rising inflation pressures.
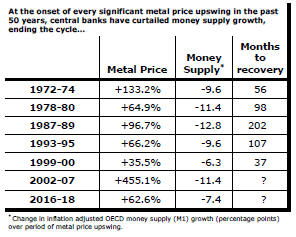 The greatest danger to a metal price cycle comes when monetary policy
settings begin to tighten in response to higher inflation with an adverse
effect on output growth and investment spending.
The greatest danger to a metal price cycle comes when monetary policy
settings begin to tighten in response to higher inflation with an adverse
effect on output growth and investment spending.
This far into a cycle, monetary policy settings would usually be tightening, sometimes quite aggressively.
Policy settings are changing more gradually than in the past because competitive forces within labour markets are holding back inflation pressures.
While this beneficial effect on inflation has persisted for longer than anticipated, policymakers are working on the assumption of it coming to an end. Policy is already becoming less supportive as declining growth in US and global money supply attests.
The monetary constraints already applied to the global economy are consistent with the metal price cycle nearing or being past its peak, based on the historical reactions to declining growth in monetary aggregate,,
Metal Price Term Structure - Chart 1
Some tightening in nonferrous metal price spreads was led by emerging backwardations in London Metal Exchange lead and zinc prices.
The tightening in spreads is modest by the standards of what is possible but overall physical market balances do not appear to be changing enough for the shift in premiums to move more dramatically.
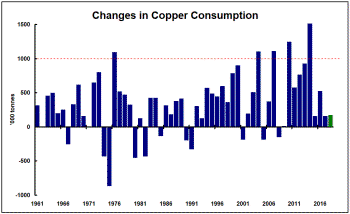 The International Copper Study Group (ICSG) has reported
that demand for the metal in 2017 rose by 0.7%, the smallest annual increase in demand since 2009.
The International Copper Study Group (ICSG) has reported
that demand for the metal in 2017 rose by 0.7%, the smallest annual increase in demand since 2009.
The succession of million tonne-plus increases in annual copper usage during the first decade of the century, requiring new metal making capacity, is not being reproduced.
The International Lead Zinc Study Group has reported that zinc usage has not changed significantly for four years.
Despite unusually slow growth in metal usage, market balances have been kept in check by declines in mine output.
Constraints on the supply side have helped deliver tighter market conditions than would otherwise have been experienced but these can be reversed.
With only moderately increasing rates of usage across the major daily traded metals, relatively narrow metal price spreads may indicate market conditions are insufficiently strong (and possibly subject to reversal if producers choose to do so) to carry the cycle significantly further.
Chinese Growth Momentum - Chart 4
Chinese manufacturing has enjoyed a prolonged expansion since early 2017 which has helped build positive sentiment for investments in the mining sector (as illustrated in the fourth chart in the right hand panel and the view below of the most recent five years).
China's official statistical agency reported that GDP
had grown by 1.4%, or at an annualised rate of 5.7%, in the March quarter of
2018. The relatively slow pace of growth if maintained would have
fallen
significantly short of the growth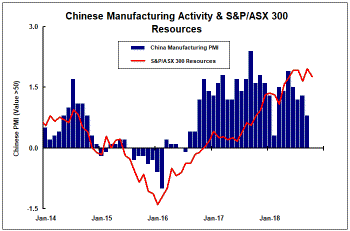 targeted by Chinese leaders.
Chinese growth is destined to head lower in coming years but China has consistently met annual statistical goals in recent years through periodic growth surges. The same is occurring in 2018.
Official purchasing managers statistics for manufacturers since February suggest a recovery from an apparent slowing in activity in the early weeks of 2018 although some momentum loss is now evident.
The Chinese government has announced that GDP rose by 6.5% over the year to September 2018 with a quarterly growth rate of 1.6%.
Immediately following the release of the national accounts data, Chinese authorities moved to shore up markets and capital spending.
Accepting the accuracy of the data, the government
appears to have been able to do just enough to meet its targets. As
this becomes progressively harder, Chinese policymakers will
 be
forced to gradually guide expectations lower.
be
forced to gradually guide expectations lower.
Current Chinese growth rates remain highly dependent on bank lending despite widespread agreement that the flow of funds is creating longer term distortions which will need addressing.
More accommodating policy settings than have been in place for the past several years are highly unlikely, biasing any cyclical risks for raw material markets to the downside.
The restructuring of the Chinese economy with a resulting contraction in the contribution to Chinese GDP of investment spending will have a generally detrimental effect on raw material demand.
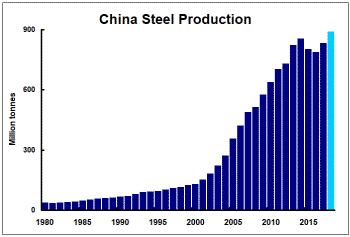
Chinese steel production in 2017 was higher than in 2016 but little different from four years earlier.
Other signs of subdued momentum have been evident in statistics released by the International Copper Study Group and the International Lead Zinc Study Group.