The Current View
The PortfolioDirect cyclical guideposts suggest that the best possible macroeconomic circumstances for the resources sector will involve a sequence of upward revisions to global growth forecasts, the term structure of metal prices once again reflecting rising near term shortages, a weakening US dollar, strong money supply growth rates and positive Chinese growth momentum.
Four guideposts are now "flashing amber" after the recent swing in sentiment about global growth prospects offered a fresh "red" warning sign. Overall, the guideposts are suggesting a low point in the cycle without yet having all the signs necessary for a conclusive cyclical turn.

Has Anything Changed? - Updated View
From mid 2014, the metal market cyclical position was characterised as ‘Trough Entry’ with all but one of the PortfolioDirect cyclical guideposts - the international policy stance - flashing ‘red’ to indicate the absence of support.
Through February 2016, the first signs of cyclical improvement in nearly two years started to emerge. The metal price term structure reflected some moderate tightening in market conditions and the guidepost indicator was upgraded to ‘amber’ pending confirmation of further movement in this direction.
As of early December 2016, the Chinese growth momentum indicator was also upgraded to amber reflecting some slight improvement in the reading from the manufacturing sector purchasing managers index. Offsetting this benefit, to some extent, the policy stance indicator was downgraded from green to amber.
At the end of July 2017, the exchange rate guidepost was upgraded to green.
As 2017 ended, there were emerging signs of economic forecasters beginning a sequence of growth forecast upgrades prompting a revision of the global growth guidepost to "green".
Three quarters of the way through 2018, global growth appeared to have peaked and the US dollar was on the rise, both warranting guidepost downgrades. The cyclical positioning was downgraded to 'downswing'.
As 2019 commenced, the balance of cyclical forces moved more sharply negative. Global growth forecasts are coming down and Chinese growth momentum is facing stronger headwinds.
The early 2020 COVID-19 pandemic aggravated a tendency to cyclical weakness which had become evident as much as a year earlier.
The unprecedented policy changes by governments and central banks in response to the damaging effects of the COVID-19 pandemic, including support for swift vaccine manufacture, tended to swamp negative tendencies elsewhere. Expectations about the near term pace of economic growth, although much improved at the start of 2021, concealed an implied underlying slowdown once the 2020 base effect had passed, leaving most guideposts stalled on amber.
As 2022 progressed, the negative cyclical outlook intensified. Favourable global monetary conditions were removed. Then the pace of global growth revisions picked up and, as US interest rates rose, the US dollar exchange rate became increasingly unfavourable.
As 2024 began,, the change in the metal price term structure started to signal lessened metal supply anxieties. Possibly related, the momentum of post-COVID Chinese growth was on a weakening trend. Global growth revisions became a more neutral influence having caught up to the lowered growth landscape. Meanwhile, monetary conditions remained restrictive. The US dollar remained relatively neutral.
At the end of 2024, the balance of indicators had not improved other than for China's growth momentum having moved to a neutral position insofar as the previously deteriorating track had stabilised.
Growth forecasts have since been threatened by the uncertainties imposed on global growth by US government efforts to recast international trade patterns.
Cyclical Position
The unprecedented response by governments and central banks to the the damaging effects of the COVID-19 pandemic concealed pre-existing tendencies to cyclically weaker conditions.
With policy having switched from support for consumption to targeting high inflation, downside growth risks had escalated but have become less intense more recently.
So, too, has market anxiety about the availability of metal supplies.
The US dollar remains unusually elevated but the upside momentum appears to have subsided.
Overall, after the balance of risks moderated through 2024, cyclical positioning became more consistent with a nearing change in direction.
While the cyclical trajectory since late 2024 had been consistent with an upcoming recovery path, it remained weaker than in past cycles.
Global Growth - Forecast Revisions
Positive variations in IMF growth forecasts during 2021 have given way to downward revisions as the negative forces detrimentally affecting growth prior to the onset of the COVID-19 pandemic reasserted themselves and as emergency policy measures supporting growth have been withdrawn.
Forecasters had been warning that global economic growth had begun a lengthy stretch on a lower growth trajectory well before the impact on economic activity of the COVID-19 outbreak.
Putting aside the post-COVID recovery period, underlying global growth
appears to have peaked in the latter part of 2017.

Overlaying the pre-existing tendency to slower growth has been a historically strong surge in global inflation which caught central banks by surprise and raised the risk of policymakers pushing large parts of the global economy into recession.
The recession threat was averted partly through large scale fiscal support for domestic spending and the productivity benefits flowing from supply chain investments.
The global economy appeared to be settling into a period of unusually slow but stable growth with few evident upside risks but significant downside risks associated with geopolitical events and still restrictive monetary conditions as central banks proceeded cautiously to unwind their anti-inflation stances.
The risks to the global economy have been dramatically impacted since the start of 2025 by the trade policies of the new Trump administration, although the strategic intent of the policy shift and its duration has appeared unclear.
In any event, the US policy changes have forced widespread downgrades in global growth forecasts and swung the balance of risks strongly toward expectations of further downside growth revisions.
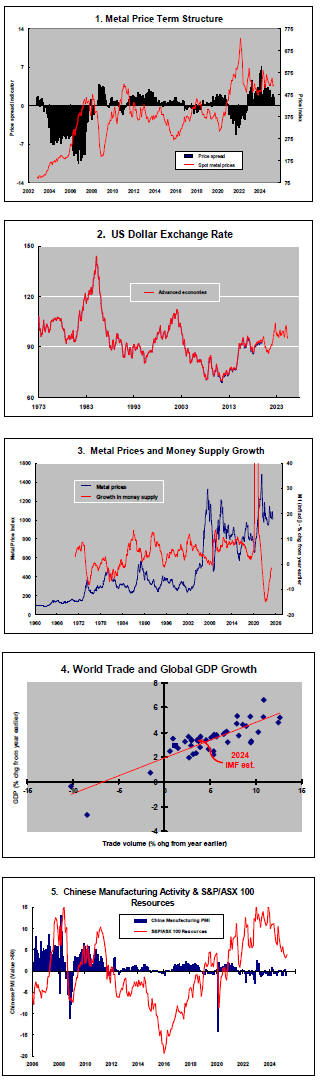
US Dollar Exchange Rate - Chart 2
Over the past 45 years, a 1% fall/rise in the US dollar trade weighted index has come with an average rise/fall of 3% in nonferrous metal prices.
 The US dollar has remained elevated for an unusually
prolonged period over recent years after having been on a general downtrend
from the early 1970s to the mid-2010s.
The US dollar has remained elevated for an unusually
prolonged period over recent years after having been on a general downtrend
from the early 1970s to the mid-2010s.
Relatively strong US equity markets and the safe haven attributes of US
bonds have attracted investors to US dollar denominated assets.
 While remaining elevated, the upward bias to the US
currency has dissipated in recent years.
While remaining elevated, the upward bias to the US
currency has dissipated in recent years.
The prospects for US growth and relative asset returns are likely to be major currency drivers in the years ahead. On the negative side of the ledger, US government funding needs are likely to become a drag.
How these factors play out is being complicated by recent Trump administration policy swings which threaten growth outcomes, add uncertainty to asset returns and are likely to make foreign bondholders less attracted to US debt.
International Policy Stance - Charts 3&4
Macro policy, as it impacts the mining industry, emanates most crucially from central banks but government fiscal policies and initiatives to enhance trade flows and productivity outcomes also play important roles.

The unprecedentedly strong infusion of global liquidity in response to the COVID-19 pandemic helped stoke asset prices, including the prices of those commodities of particular importance to the mining industry.
The greatest danger to a metal price cycle comes when monetary policy settings begin to tighten in response to higher inflation with an adverse effect on output growth and investment spending.
In previous cycles, authorities have moved to stem monetary growth rates while metal prices have been on the rise, sometimes quite aggressively, in an effort to prevent the rise of inflation pressures. The tightening in policy has typically cut short price cycles.
At the onset of every significant metal price upswing in the past 50 years, central banks have curtailed money supply growth, bringing an end to the nascent cycle.
The variable lags between a change in monetary policy settings and the impact on asset prices and real activity make timing hard to predict but a loosening of policy is an important precondition for a major cyclical recovery in metal prices and the speculative flows which carry equity prices higher.
Metal Price Term Structure - Chart 1
Growing market anxiety about near term shortages of metal supply, a key feature of a cyclical upturn, typically coincide with a rising backwardation.
Future dated metal prices rising faster than spot prices will signal a loss of near term demand and downward cyclical pressure.
The summary measure of the metal price term structure drawn from the price performance of LME traded metals, shown in the first of the cyclical guidepost charts, suggests relatively few supply anxieties among market participants presently in contrast to the outcome in 2021-22 when markets experienced the most recent significant price cycle.
In recent months, the contango proxy measure shown in the chart has edged lower, tending to support a slightly stronger cyclical position but still leaving the market poised in a broadly neutral setting.
Chinese Growth Momentum - Chart 5
The momentum of Chinese economic activity slackened significantly as COVID pandemic restrictions adversely impacted manufacturing activity and global trade flows.
Despite the passage of time, China has been unable to
cast off the resulting malaise to return to the more robust activity
patterns which had previously prevailed.
Chinese growth was destined to head lower even without the pandemic disruption, in any case. Immediately prior to the pandemic, growth rates were the slowest in a decade, pointing to a likely permanent downward shift in the momentum of economic activity.
The restructuring of the Chinese economy with a resulting contraction in the contribution to Chinese GDP of investment spending would have had a generally detrimental effect on raw material demand.
In the absence of market reforms comparable in importance to those which have occurred historically, the sensitivity of growth to monetary and fiscal policy changes in China has been falling.
The renewed trade rivalry between China and the USA is now aggravating China's growth predicament with the rising probability of a more serious momentum loss. With other Asian economies now deeply entwined in China related trade and supply chains, a serious regional slowdown also becomes more likely in coming months.