The Current View
Growth in demand for raw materials peaked in late 2010. Since then, supply growth has continued to outstrip demand leading to inventory rebuilding or spare production capacity. With the risk of shortages greatly reduced, prices have lost their risk premia and are tending toward marginal production costs to rebalance markets.
To move to the next phase of the cycle, an acceleration in global output growth will be required to boost raw material demand by enough to stabilise metal inventories or utilise excess capacity.
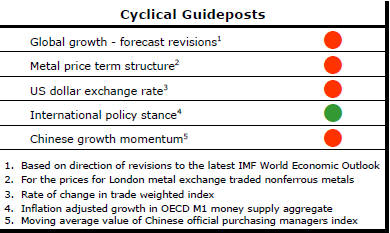
The PortfolioDirect cyclical
guideposts suggest that the best possible macroeconomic circumstances for
the resources sector will involve a sequence of upward revisions to
global growth forecasts, the term structure of metal prices once again
reflecting rising near term shortages, a weakening US dollar, strong money
supply growth rates and positive Chinese growth momentum. Only one of
the five guideposts is "set to green" suggesting the sector remains confined
to the bottom of the cycle .
Has Anything Changed?
Throughout 2014, PortfolioDirect had been characterising the cyclical position as ’Trough Entry’ with some expectation that by the end of 2014 an exit would be evident. Until very late in the year, the evidence supported that possibility before conditions took several backward steps.
The absence of a growth acceleration among the major economic regions is contributing to the flagging momentum. A stronger US dollar is also imparting a downward bias to US dollar denominated prices presently.
This change has been enough to define a fresh cycle and a more prolonged adjustment process.
Oil Prices Lead the Way - For Now
Another year begins with the hope that mining asset prices have stabilised
but the supporting evidence is mixed, at best.
Sliding oil prices have been setting the tone for equity markets. There is no history to suggest a permanently high correlation. Changes in other intervening factors in a complicated global economic setting will break the nexus eventually.
Conceptually, one would expect falling
oil prices to give mainstream equity and bond markets a fillip. Rising oil
prices, on the other hand, are likely to herald inflationary pressures,
higher interest rates and reduced household spending all of which are bad
for markets.
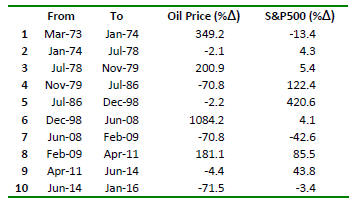
Not surprisingly, real life has been more complicated. The table summarises ten phases in oil prices since the first oil price shock in the early 1970s. The last column of the table shows changes in the S&P 500 over these same periods.
Historically strong oil price rises such as in periods 1, 3 and 6 in the table have coincided, as expected, with falling or weak increases in security prices. Against this trend, the rise in period 8 accompanied a rapid appreciation in equity prices.
The 71% oil price fall in period 4 followed by a prolonged period of little change in prices during period 5 came with record rises in equity prices, also as expected. The 71% fall in period 7, however, came with a large fall in equity prices. While the latest (coincidental) 71% fall in prices in period 10 has become a market preoccupation, the reaction has been relatively modest.
Since 1970, the direction of equity market and oil price returns had coincided 44% of the time. This jumped to 54% after 2000 and has been running in excess of 65% since.
The near term correlation between oil prices and U.S. equity prices has been unusually strong. The persistence of the connection has made traders reluctant to bet against its continuation despite doubts about the existence of any sustaining fundamental linkages.
Some analysts had characterised the initial phases of the current oil price slump in late 2014 as beneficial for global growth and, consequently, equity markets. They will have recognised the existence of losers, namely, oil exporters but would have been cheered by potentially beneficial effects on household consumption spending in Japan, Europe and the USA.
The touted benefits have not materialised as expected. Beneficiaries of lower oil prices have been coy about taking advantage of the windfall. The priority being placed on debt management in Europe and the USA has limited the flow through into spending effects. Some scepticism about its permanence has been evident although that will erode over time.
While the growth impact has been muted, oil price changes have also created problems. Prices have aggravated geopolitical risks. Unprecedented political challenges already faced by Saudi Arabia and Russia have been exacerbated by the plunge in the price of one of their primary sources of income. Low prices are disrupting relations among political neighbours and adding to an already complicated international setting.
The political coalition which had managed the oil market has given way to a market free for all in which no single group or entity is able or willing to exert influence. This has added additional market volatility. Markets will get used to the resulting uncertainty but, until then, the absence of an acknowledged replacement adjustment mechanism will contribute volatility.
Another reason for an out of character reaction to low oil prices is that inflation is not the problem it used to be. More to the point, policymakers are openly canvassing the threat of deflation as an impending macroeconomic danger. Falling oil prices have aggravated, at least in the minds of some, a perilous deflationary bias in the world economy. With the nervousness of central bankers on display, low oil prices are translating into a market threat rather than a benefit.
To some extent, commentators are latching onto the oil price as a convenient explanatory variable in an otherwise complicated macroeconomic environment in which structural and cyclical factors are interacting in different ways to produce a global economic outcome.
The bias in U.S. monetary policy has changed as quantitative easing has been wound back and the first of the interest rate rises from the Federal Reserve has been anticipated. There is also some argument about whether the central bank has mistimed its policy switch so badly that it now risks tipping the U.S. economy into recession.
A strengthening U.S. dollar has curtailed U.S. exports and damaged its manufacturing output growth placing a lid on higher wage jobs growth and, consequently, consumer spending. Falling oil sector capital spending has also curtailed growth. Meanwhile, corporate earnings have begun contracting.
Globally, the pattern of growth has deteriorated. China’s inexperienced policymakers are attempting a delicate structural adjustment having relinquished many of their previously successful policy tools. They have subsequently contributed market disruption by appearing disappointingly uncertain at times and timid in the implementation of their policy.
Several of the largest developing nations have been battling growth-sapping structural problems. At the same time, Europe and Japan have been able to offer only minimal additional momentum.
Market commentators habitually look for simplistic explanations for complex interactions among huge numbers of economic variables. Oil prices are being used as an indicator of currently legitimate worries about global growth outcomes. This will continue until it stops and until those preoccupied with oil prices latch onto another overly simplistic explanation for why markets are behaving as they are.