The Current View
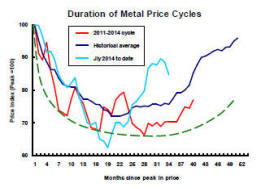
Growth in demand for raw materials peaked in late 2010. Since then, supply growth has generally outstripped demand leading to inventory rebuilding or spare production capacity. With the risk of shortages greatly reduced, prices lost their risk premia and have been tending toward marginal production costs to rebalance markets.
The missing ingredient for a move to the next phase of the cycle is an acceleration in global output growth which boosts raw material demand by enough to stabilise metal inventories or utilise excess capacity.
The PortfolioDirect cyclical
guideposts suggest that the best possible macroeconomic circumstances for
the resources sector will involve a sequence of upward revisions to
global growth forecasts, the term structure of metal prices once again
reflecting rising near term shortages, a weakening US dollar, strong money
supply growth rates and positive Chinese growth momentum. None of the five guideposts is "set to green"
(after the most recent adjustments in December 2016) suggesting the sector remains confined
to near the bottom of the cycle.

Has Anything Changed? - Updated View
From mid 2014, the metal market cyclical position was characterised as ‘Trough Entry’ with all but one of the PortfolioDirect cyclical guideposts - the international policy stance - flashing ‘red’ to indicate the absence of support.
Through February 2016, the first signs of cyclical improvement in nearly two years started to emerge. The metal price term structure reflected some moderate tightening in market conditions and the guidepost indicator was upgraded to ‘amber’ pending confirmation of further movement in this direction.
As of early December 2016, the Chinese growth momentum indicator was also upgraded to amber reflecting some slight improvement in the reading from the manufacturing sector purchasing managers index. Offsetting this benefit, to some extent, the policy stance indicator has been downgraded from green to amber. While monetary conditions remain broadly supportive, the momentum of growth in money supply is slackening while further constraints on fiscal, regulatory and trade regimes become evident.
Gold Doesn't Like Uncertainty
Gold is often described as an antidote to market uncertainty but buoyant
markets are more likely to support higher gold prices than more volatile
markets worried about the outlook.
Gold is one of a myriad of assets making up total wealth holdings.
The value of gold holdings is the difference between total wealth and the value of wealth held in all other forms.
The price of gold, within this framework, will depend on the prices and quantities of other financial assets, the total value of wealth and the quantity of physical gold held.
The gold price will benefit from rising wealth and, if
other relative prices are unchanged, fall if wealth is also being reduced.
Consequently, buoyant equity and financial market conditions contribute to
higher gold prices.

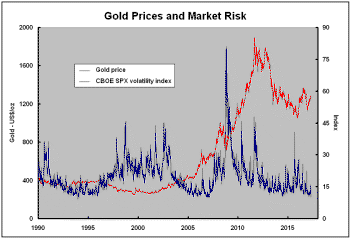
The chart shows a near 30 year history of gold prices and the CBOE S&P 500 volatility index often referred to as the VIX and used by traders as a measure of market anxiety.
There is no evidence in this relationship of gold being a hedge against market volatility (i.e. the gold price rising when market volatility is high).
Generally, when the VIX has been low, gold prices are on the rise. When the VIX is relatively high, gold prices have tended to be weak. A rising VIX has been associated with weakening gold prices.
One noticeable deviation from this pattern occurred in 2013 when the VIX was low but gold prices were also falling.
The sizable fall in the gold price during this period coincided with a rise in the U.S. dollar exchange rate which remains another important influence on U.S. dollar denominated prices.
The two competing influences - a higher exchange rate and falling market risk - ended up with the exchange rate effect dominating.
Most recently, the VIX has been low and the exchange rate has been falling. Unsurprisingly, given the historical relationships, gold prices have been rising.
The VIX currently shows investors are highly confident about market conditions. The balance of market risk favours this complacency being disrupted with a reversal in equity market direction impacting adversely on gold prices.
Higher U.S. interest rates during 2017 are likely to place upward pressure on the U.S. dollar as long as monetary policies elsewhere remain relatively more accommodating.
Markets have also become relatively expensive, as the comments below point out.
In short, financial and equity markets may be in the midst of the best of times for the gold price with solid arguments available for why those conditions are more likely to be reversed than sustained or pushed further along the same path.
US Growth Slows Again
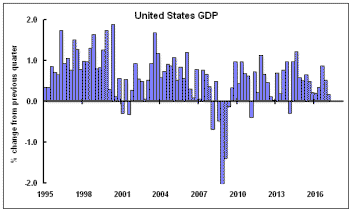
On Friday, the US government released its first estimate of GDP for the
March quarter. US growth, which has averaged only 2% annually since the
end of 2009, struggled to reach an annualised rate of 0.7% in the quarter –
the lowest quarterly growth rate in three years.
 The
surprisingly low rate of expansion in the first quarter means the US economy
will have to grow at its fastest pace since 2005 in the remainder of 2017 to
realise the current IMF forecast.
Some catch-up is likely. Growth, at the time, will be deemed ‘surprisingly strong’. Some will be fooled into thinking the cycle is alive and well.
Unfortunately, the incidence of positive surprises in the US and elsewhere is increasingly relying on previously lowered expectations or unusually weak prior outcomes.
The disturbingly consistent reappearance of weakening growth momentum damages equity-price outcomes and encourages scepticism about sector investment outcomes, one reason the ASX small resources share price index has made no net gain since it rose through the first half of 2016.
As momentum ebbs and flows around growth outcomes insufficiently strong to meaningfully raise the pressure for a cyclical upturn, prices are susceptible to periods of occasionally attractive but, ultimately, unsustainable returns.


