The Current View
Growth in demand for raw materials peaked in late 2010. Since then, supply growth has continued to outstrip demand leading to inventory rebuilding or spare production capacity. With the risk of shortages greatly reduced, prices have lost their risk premia and are tending toward marginal production costs to rebalance markets.
To move to the next phase of the cycle, an acceleration in global output growth will be required to boost raw material demand by enough to stabilise metal inventories or utilise excess capacity.
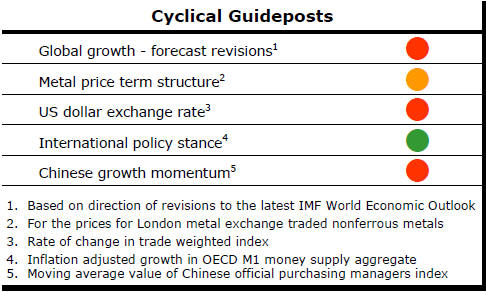
The PortfolioDirect cyclical
guideposts suggest that the best possible macroeconomic circumstances for
the resources sector will involve a sequence of upward revisions to
global growth forecasts, the term structure of metal prices once again
reflecting rising near term shortages, a weakening US dollar, strong money
supply growth rates and positive Chinese growth momentum. Only one of
the five guideposts is "set to green" suggesting the sector remains confined
to the bottom of the cycle .
Has Anything Changed? - Updated View
Since mid 2014, the metal market cyclical position has been characterised as ‘Trough Entry’ as prices have remained in downtrend with all but one of the PortfolioDirect cyclical guideposts - the international policy stance - flashing ‘red’ to indicate the absence of support.
The absence of a global growth acceleration, a stronger dollar and flagging Chinese growth momentum remain critical features of the current cyclical positioning.
Through February 2016, the first signs of cyclical improvement in nearly two years started to emerge. After 15 months of contango, the metal price term structure shifted to backwardation reflecting some moderate tightening in market conditions.
The metal price term structure is the most sensitive of the five cyclical guideposts to short term conditions and could, consequently, quickly reverse direction. Nonetheless, this is an improvement in market conditions and the guidepost indicator has been upgraded to ‘amber’ pending confirmation of further movement in this direction.
Credit Markets Signal Support for Miners
Is gold moving the market? Is it lithium? Are commodity prices, more
generally, behind recovering mining equities?
Commodity prices have improved but remain cyclically
very weak by historical standards. A broader set of macro influences have
been supporting mining equities.
The global appetite for risk has been moving in favour of the sector throughout 2016.
The chart shows Australia’s small resources share price index (in the blue line) and the Bloomberg global high yield corporate bond index (in the red line) over the past two and a half years.
The bond index is a proxy for risk appetite as well as an indicator of capital accessibility within the mining industry. While funding remains historically tight, the path of the bond price index suggests marginal improvements in funding conditions have occurred which will have given equity prices some additional momentum.
Credit markets often set the tone for equity prices, particularly in the industrial part of the market where bond yields are important valuation guideposts.
The high yield indicator is a more relevant gauge for the direction of mining equity prices particularly in the near term despite commodity prices being the source, eventually, for any cyclical uplift in sector equity values. is a dramatic example of the interaction of religion, changing social mores, health and lifestyle on economic growth outcomes.
Australian Profit Share Signal Tougher Market
Conditions
Australia is in the midst of a reversal in its corporate profit share to the
levels which had prevailed over more than four decades prior to 2000.
The positioning of the Australian equity market reflects this historically strong reversion to the norm.
The brunt of the decline in Australia’s corporate
profits has been taken by resource sector equity prices. A collapse in
resource sector profits is the largest element in the change in overall
corporate profit share but approximately one-third of the decline comes from
non-resources parts of the economy.
The positioning of the Australian share market has normally reflected movements in the profit share which is akin to a macro measure of business profit margins.
The chart shows the profit share (in the blue line and measured as corporate non-financial gross operating surplus as a percentage of non-farm GDP) and the inflation adjusted All Ordinaries share price index (in yellow).
Presently, there is an unusual directional divergence between these two measures. In part, the difference reflects the process of recovery from the 2008 share market slump but an unprecedentedly strong unleashing of liquidity into financial markets will also be working to support equity prices.
In any event, as long as the profit trajectory is moving in the wrong direction, the Australian market will be depending heavily on this central bank support.