The Current View
Growth in demand for raw materials peaked in late 2010. Since then, supply growth has continued to outstrip demand leading to inventory rebuilding or spare production capacity. With the risk of shortages greatly reduced, prices have lost their risk premia and are tending toward marginal production costs to rebalance markets.
To move to the next phase of the cycle, an acceleration in global output growth will be required to boost raw material demand by enough to stabilise metal inventories or utilise excess capacity.
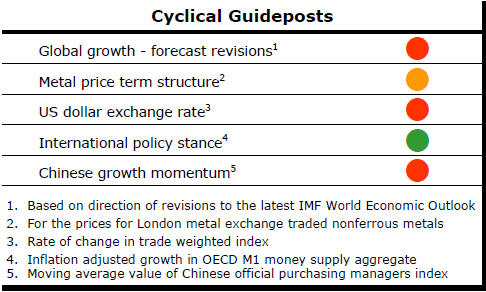
The PortfolioDirect cyclical
guideposts suggest that the best possible macroeconomic circumstances for
the resources sector will involve a sequence of upward revisions to
global growth forecasts, the term structure of metal prices once again
reflecting rising near term shortages, a weakening US dollar, strong money
supply growth rates and positive Chinese growth momentum. Only one of
the five guideposts is "set to green" suggesting the sector remains confined
to the bottom of the cycle .
Has Anything Changed? - Updated View
Since mid 2014, the metal market cyclical position has been characterised as ‘Trough Entry’ as prices have remained in downtrend with all but one of the PortfolioDirect cyclical guideposts - the international policy stance - flashing ‘red’ to indicate the absence of support.
The absence of a global growth acceleration, a stronger dollar and flagging Chinese growth momentum remain critical features of the current cyclical positioning.
Through February 2016, the first signs of cyclical improvement in nearly two years started to emerge. After 15 months of contango, the metal price term structure shifted to backwardation reflecting some moderate tightening in market conditions.
The metal price term structure is the most sensitive of the five cyclical guideposts to short term conditions and could, consequently, quickly reverse direction. Nonetheless, this is an improvement in market conditions and the guidepost indicator has been upgraded to ‘amber’ pending confirmation of further movement in this direction.
Cyclical Progress Continues
Progress remains slow and uncertain but cyclical conditions are improving
gradually.
Metal prices have continued to rise. The PortfolioDirect metal price indicator was at its highest point at the end of April since July 2015.
Exchange Rate Direction Change
The broader macro growth environment has not supported the higher prices as
much as the swing in exchange rates. Chart 2 in the panel on the right now
shows clearly a change in the direction of the U.S. dollar exchange rate.
This relief for the sector comes from a reassessment of the likely trajectory of U.S. interest rates. With U.S. economic data appearing significantly weaker over the past three months than had been expected based on outcomes in the latter part of 2015, the perceived likelihood of future U.S. interest rate rises in 2016 has been pared back by financial markets. The resulting portfolio adjustments have benefited U.S. dollar denominated metal prices.
Despite this near term reappraisal of U.S. interest rates, the balance of risks suggests higher U.S. interest rates during 2016 (albeit by less than had been expected) and possibly still lower interest rates or more aggressive quantitative easing policies in Europe and Japan where policymakers would prefer their respective exchange rates to fall.
This scenario highlights the possibility that upcoming monetary policies will result in the reversal of the recent metal price gains which have benefited the resources industry.
Monetary policies will continue to act primarily on asset prices. Limited policy effects on growth in real output with the capacity to impact physical market balances are likely to lag the price effects.
Tighter Price Spreads
The term structure of metal prices shown in the first chart in the right
hand panel has continued to show generally tighter forward price spreads
than have prevailed over the past year. At the end of April, forward zinc,
tin and copper prices were trading at discounts to their corresponding spot
prices indicating a modest tightening in conditions and an improvement in
the pace of market adjustment.
Banks and Resources - the Biggest Call
‘Banks versus resources’ is the big call for any Australian equity portfolio
manager. Get that choice right and little more needs to be done to
outperform the major Australian equity market benchmarks.
The switch between sectors is also a low frequency trade. Throughout the past five years, the balance of risks has favoured retaining positions in the banks in preference to an exposure to the resources sector.
More recently, the balance of risks has been moving toward a more neutral positioning. The resources/banks relative performance now resembles the outcome in the late 1990s. At that point, several more years were required before evidence of a clear-cut cyclical swing would emerge but the incentive to choose one sector over the other had been neutralized.
With the worst of the cyclical adjustment now largely over for the resources sector and banks facing their own cyclical and structural headwinds with falling interest rates and changes to their regulatory framework, a late 1990s style portfolio reappraisal once again seems warranted.