The Current View
A lengthy downtrend in sector prices had given way to a relatively stable trajectory after mid 2013 similar to that experienced in the latter part of the 1990s and first few years of the 2000s.
The late 1990s and early 2000s was a period of macroeconomic upheaval during which time sector pricing nonetheless proved relatively stable. That remains a possible scenario for sector prices.
Relative stability suggests a chance for companies genuinely adding value through development success to see their share prices move higher. This was the experience in the late 1990s and early 2000s.
The lower equity prices fall - and the higher the cost of capital faced by development companies - the harder it becomes to justify project investments.
Has Anything Changed?
A 1990s scenario remains the closest historical parallel although the strength of the US dollar exchange rate since mid 2014 has added an unusual weight to US dollar prices.
The first signs of cyclical stabilisation in sector equity prices have started to show. This has meant some very strong ‘bottom of the cycle’ gains but only after prices have already fallen by 70% or more in many cases leaving prices still historically low.
Funding for project development may have passed its most difficult phase at the end of 2015 with signs of deals being done and evidence that capital is available for suitably structured transactions.
Key Outcomes in the Past Week
The week finished with oil prices and U.S. equity prices moving in opposite directions, seemingly breaking the nexus between the two prices which had prevailed since November.

The flow of quarterly earnings reports has confirmed a US corporate earnings recession. The earnings retreat has been aggravated by low oil prices (and consequentially lower capital spending) and a stronger U.S. dollar which has detrimentally affected the earnings of manufacturers and exporters. One result has been a deterioration in valuation which is likely to crimp ongoing market performance.
Technology company earnings have been mixed as the particular exposure of individual companies has driven outcomes. High profile examples of differences in trend have included, for example, Apple and Amazon.
Low interest rates are also throwing up doubts about the earnings of financial services companies. This pressure comes on top of the costs imposed by new regulations and capital adequacy requirements.
These sectoral pressures benefit the resources sector which is easing into a more level investment playing field than had been the case over the past five years.
Despite the absence of a clear-cut cyclical recovery in commodity prices, the sector faces a significantly improved relative position against other key parts of the market competing for investible funds.
Gold Equity Price Risks
The speed of the rise in gold equity prices suggests caution should be
exercised in joining the rush.
Since the end of December 2015, the gold bullion price
has risen 22% although only at the end of last week has it appeared to
breach the upper end of a trading downtrend dating from 2013.

Not surprisingly, gold equity prices have been highly leveraged to this bullion price move. The Philadelphia Gold and Silver equity index, for example, has risen 105%. The ASX All Ordinaries gold equity price index has risen 57%.
On Friday, the Philadelphia price index closed 71% above its 200 day moving average. Since 1985, there has only been one single day on which the deviation has been (only slightly) more pronounced. In April 1987, the gold price rose 6% over a fortnight while the equity index rose 28% before tumbling 13% as the gold price was still heading some 7% higher toward its peak price of US$475/oz.
As in 1987, the balance of risks, even in the event the gold price moves higher, has tilted against newly entering equity investors.
Uranium Struggles Against the Trend
The uranium segment of the resources equity market has performed much like
the broader sector, despite its apparently stronger outlook, with a multi
year downtrend in prices. The chart showing the Global-X uranium exchange
traded fund is one indicator.
The fund’s price has gained 8.2% since the beginning of January 2016 but, as the chart illustrates, the momentum has stalled and the sector price has remained confined within the constraints of the five year downtrend.
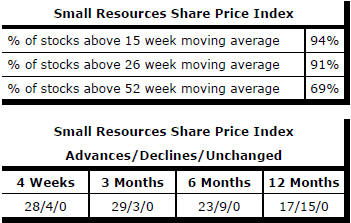
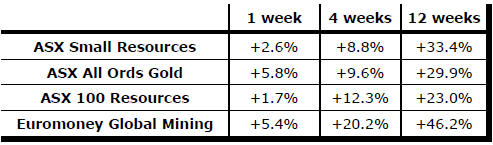
Market Breadth Statistics