The Current View
Growth in demand for raw materials peaked in late 2010. Since then, supply growth has continued to outstrip demand leading to inventory rebuilding or spare production capacity. With the risk of shortages greatly reduced, prices have lost their risk premia and are tending toward marginal production costs to rebalance markets.
To move to the next phase of the cycle, an acceleration in global output growth will be required to boost raw material demand by enough to stabilise metal inventories or utilise excess capacity.
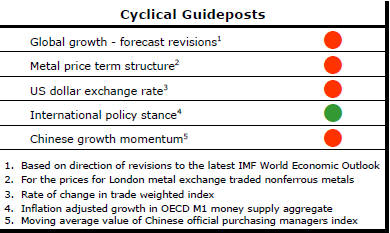
The PortfolioDirect cyclical
guideposts suggest that the best possible macroeconomic circumstances for
the resources sector will involve a sequence of upward revisions to
global growth forecasts, the term structure of metal prices once again
reflecting rising near term shortages, a weakening US dollar, strong money
supply growth rates and positive Chinese growth momentum. Only one of
the five guideposts is "set to green" suggesting the sector remains confined
to the bottom of the cycle .
Has Anything Changed?
Throughout 2014, PortfolioDirect had been characterising the cyclical position as ’Trough Entry’ with some expectation that by the end of 2014 an exit would be evident. Until very late in the year, the evidence supported that possibility before conditions took several backward steps.
The absence of a growth acceleration among the major economic regions is contributing to the flagging momentum. A stronger US dollar is also imparting a downward bias to US dollar denominated prices presently.
This change has been enough to define a fresh cycle and a more prolonged adjustment process.
Cycle Heads Lower
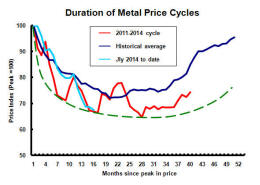
Downward metal price pressures were again evident in the past week. The
pattern of price movements is proving remarkably similar to the trajectory
of prices during 2011 and 2012 in the early stages of the 2011-14 price
cycle, as defined by the PortfolioDirect model. More
buoyant market conditions over coming months are not impossible but would be
consistent with a market continuing to adjust to the prevailing weaker
demand conditions.
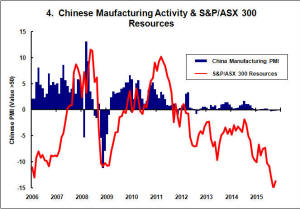
China's Manufacturing Contraction
The Chinese government reported that its survey of manufacturing purchasing
managers in October showed no change in business conditions from September.
The reading of 49.8 - the second consecutive monthly outcome below 50 -
implies an ongoing contraction in activity. Chart 4 on the right shows the
latetst survey outcome and the historical connection beteen the survey
outcomes and Australian resources sector equity prices.
While some will continue to look to this indicator for a sign of improved conditions, this may prove unrealistic in the near term as the Chinese economy restructures.
Unfortunately, a good part of the disappointment over China’s economic outcomes can be sourced to persistently unrealistic expectations. In many instances, these expectations have been cultivated by the major mining companies and raw materials trading houses badly misreading the economic outlook - as, incidentally, they almost always do. Their enthusiasm to extrapolate far exceeds their skill at forecasting turning points.
More Monetary Stimulus
Speculation that the Japanese central bank would initiate an additional
monetary stimulus package did not eventuate. While its European counterpart
had raised the possibility that highly accommodating monetary policies could
stay in place longer than earlier foreshadowed, there have been no
additional actions in the short term from Europe either.
Changes to monetary policy alone will not have a favourable impact on raw material markets. They may be necessary but almost certainly not sufficient for an improvement in cyclical conditions.
Monetary policy will affect demand for assets through varying the flow of funds but may have little or no effect on the real economy. In theory, stronger demand for financial assets will cause prices to rise and lead to stronger private sector investment with, possibly through a wealthy effect, higher consumption. But whether these connections are made in practice depends on the surrounding circumstances which, in recent years, have not been supportive.
Widening Price Spreads
The PortfolioDirect price spread guidepost has also
slipped. The first of the guidepost charts on the right summarising the
spread structure of metal prices trading on the London Metal Exchange has
been updated for October. The widening forward price structure is offering
further evidence of weaker near term conditions.
A narrowing spread would usually be consistent with rising demand and some emerging fears about access to adequate new term supplies.The market has moved in the opposite direction over the past week.