The Current View
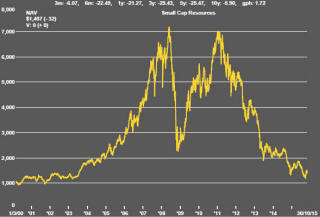
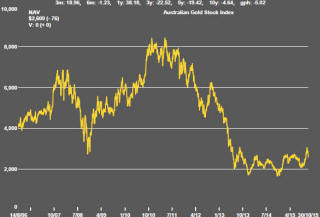
A lengthy downtrend in sector prices had given way to a relatively stable trajectory after mid 2013 similar to that experienced in the latter part of the 1990s and first few years of the 2000s.
The late 1990s and early 2000s was a period of macroeconomic upheaval during which time sector pricing nonetheless proved relatively stable. That remains a possible scenario for sector prices.
Relative stability suggests a chance for companies genuinely adding value through development success to see their share prices move higher. This was the experience in the late 1990s and early 2000s.
The lower equity prices fall - and the higher the cost of capital faced by development companies - the harder it becomes to justify project investments. The market is now entering a period prone to even greater disappointment about project delivery .
Has Anything Changed?
The assumption that June 2013 had been the cyclical trough for the market was premature.
Sector prices have adjusted to the next level of support. The parallel with the 1990s illustrated in Chart 4 is being tested. Prices will have to stabilise around current levels for several months for the thesis to hold.
Key Outcomes in the Past Week
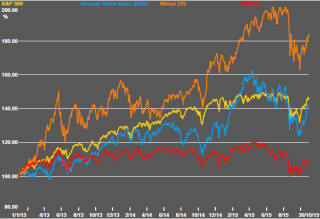
The major US equity price indices led world markets as
they posted their largest returns in October since October 2011. Murmurings
in August about a deep correction or prolonged bear market have given way to
another rapid retracement which will have reinforced in the minds of
investors the dangers of being absent from the market. At some point, this
will prove a loss making assumption but, thus far, has been the best guide
to market direction.
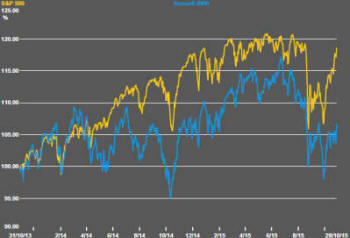
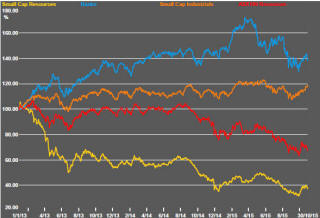
Within the indices, however, there has been a marked difference between the performance of a small number of headline stocks and the broader market. Returns among the highest profile stocks in the technology sector have been particularly important drivers of the main indices. The S&P 500 has been far quicker to recover from the August slump than the more broadly based and more domestically focused Russell 2000.
The relative performance implies that overseas investors may be using the US market as a safe haven and, in doing so, focusing on the higher profile names with greater market liquidity. Domestic investors, on the other hand, could be construed as being less optimistic.
The Chicago Board of Trade market volatility index based on S&P 500 option prices has effected a dramatic reversal over recent weeks as confidence about market prospects returned.
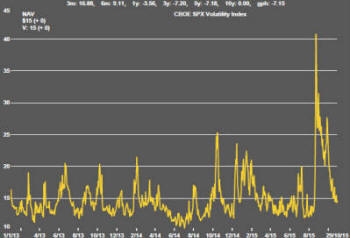 Volatility
consolidating around current or lower levels would be consistent with
outcomes over the previous three years and with a resumption of the upward
trend in the market. That said, the two factors that intervened in August
to disrupt markets worldwide, namely, uncertainty about the intentions of
the Federal Reserve and worries about China’s ability to sustain its growth
remain barely in the background. These two factors pose an ongoing risk of
future equally as sharp market reversals with little warning of what is
about to happen.
Volatility
consolidating around current or lower levels would be consistent with
outcomes over the previous three years and with a resumption of the upward
trend in the market. That said, the two factors that intervened in August
to disrupt markets worldwide, namely, uncertainty about the intentions of
the Federal Reserve and worries about China’s ability to sustain its growth
remain barely in the background. These two factors pose an ongoing risk of
future equally as sharp market reversals with little warning of what is
about to happen.
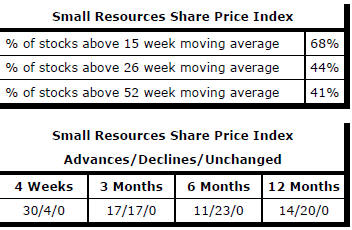
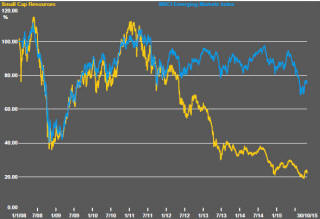
Resources sector prices fell in the last few days of the
month. The small resources share price index fell 6.3% over the week. The
S&P/ASX 100 resources index fell 5.7%. The Euromoney Global Mining Index
fell 6.9%. There was, however, a net gain for the Australian resources
sector over the month as a whole of 16.2% as the materials sector led gains
globally.
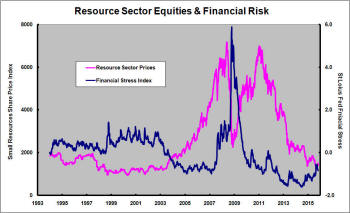
The October price movements reflected improved worldwide equity market conditions and a willingness on the part of investors to seek out companies in some of the more depressed parts of the market. Financial market conditions were generally less stressful.
Since the end of August, the St Louis Federal Reserve financial stress indicator has been pointing to a more comfortable business environment for the resources sector with a modest fall after having been on the rise through 2015. Normally, a decline in financial stress would signal a greater preparedness to incur risk in which event resource sector prices would benefit.
. .
Market Breadth Statistics