The Current View
Growth in demand for raw materials peaked in late 2010. Since then, supply growth has generally outstripped demand leading to inventory rebuilding or spare production capacity. With the risk of shortages greatly reduced, prices lost their risk premia and have been tending toward marginal production costs to rebalance markets.
The missing ingredient for a move to the next phase of the cycle is an acceleration in global output growth which boosts raw material demand by enough to stabilise metal inventories or utilise excess capacity.
The PortfolioDirect cyclical
guideposts suggest that the best possible macroeconomic circumstances for
the resources sector will involve a sequence of upward revisions to
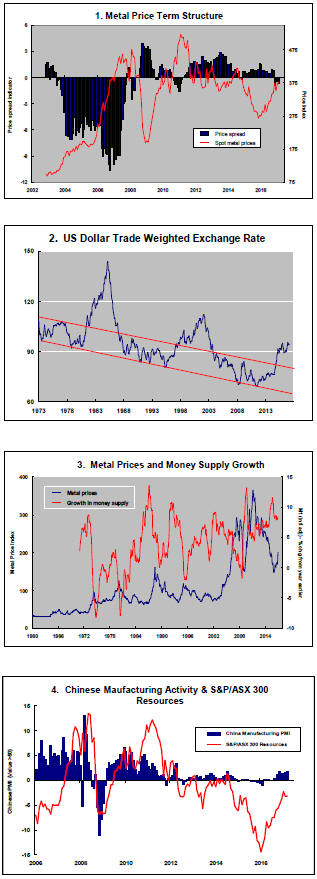
global growth forecasts, the term structure of metal prices once again
reflecting rising near term shortages, a weakening US dollar, strong money
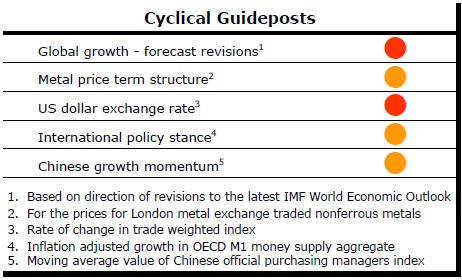
supply growth rates and positive Chinese growth momentum. None of the five guideposts is "set to green"
(after the most recent adjustments in December 2016) suggesting the sector remains confined
to near the bottom of the cycle.
Has Anything Changed? - Updated View
From mid 2014, the metal market cyclical position was characterised as ‘Trough Entry’ with all but one of the PortfolioDirect cyclical guideposts - the international policy stance - flashing ‘red’ to indicate the absence of support.
Through February 2016, the first signs of cyclical improvement in nearly two years started to emerge. The metal price term structure reflected some moderate tightening in market conditions and the guidepost indicator was upgraded to ‘amber’ pending confirmation of further movement in this direction.
As of early December 2016, the Chinese growth momentum indicator was also upgraded to amber reflecting some slight improvement in the reading from the manufacturing sector purchasing managers index. Offsetting this benefit, to some extent, the policy stance indicator has been downgraded from green to amber. While monetary conditions remain broadly supportive, the momentum of growth in money supply is slackening while further constraints on fiscal, regulatory and trade regimes become evident.
Market Balance Statistics Show Demand Weakness
Just as talk of a U.S. growth renaissance has become more common, real
activity has appeared to lose momentum.
Three recently released indicators point in the direction of growth having peaked or having reached a level beyond which progress might prove difficult.
The University of Michigan measure of consumer sentiment has peaked most recently in the December/January period.
While the survey result for March remains close to historically high levels, the main part of the upswing in sentiment is in the past.
Historically, the strongest economic growth has occurred during the upswing in sentiment or when sentiment has been at its strongest.
Based on that history, the data suggest that GDP growth could be maintained at recent rates but are unlikely to move significantly higher.
The official estimate of U.S. GDP growth has been upgraded to 2.0% over the 12 months to December 2016 but remains well short of the 4% aspirational rate used in the recent U.S. presidential election campaign by Donald Trump to harness support for his economic plans.
Much of the recent political debate in the USA has centred on use of tax cuts, lowered regulatory burdens and boosted infrastructure spending to spur economic activity.
While foreshadowed policies should be beneficial in lifting the growth potential of the U.S. economy, a jump significantly above 2% will be hard to maintain with downward pressure on the existing growth rate already evident.
Consumer spending, which accounts for around two-thirds of U.S. GDP, grew by 4.8% over the year to March 2017, the highest rate of growth since November 2014.
The unambiguous recovery in spending has underpinned the
improvement in U.S. economic conditions referred to, for example, by the
U.S. Federal Reserve but has been underway for over one year.
At the end of March 2017, spending growth was close to the peak rates achieved since 2010 and slightly below the 5.0% growth rate over the year to February 2017.
At a more micro level, the economically important motor vehicle industry is also showing signs of having run out of steam just as the new U.S. administration is exhorting the industry to make more cars in the USA.
The number of motor vehicles sold in the USA over the 12
months to February 2017 was 1.5% lower than in the corresponding period a
year earlier.
The cyclically high number of car sales was reached in the first quarter of 2016.
While the number of cars sold remains at near record levels, the direction has shifted and motor vehicle sales appear to have passed the point of being a contributor to growth.
U.S. government statistics are also showing that the motor vehicle inventories/sales ratio had risen by the end of February 2017 to the highest level since 1994 with the exception of the 2009 financial crisis related sales slump. .