The Current View
Growth in demand for raw materials peaked in late 2010. Since then, supply growth has generally outstripped demand leading to inventory rebuilding or spare production capacity. With the risk of shortages greatly reduced, prices lost their risk premia and have been tending toward marginal production costs to rebalance markets.
The missing ingredient for a move to the next phase of the cycle is an acceleration in global output growth which boosts raw material demand by enough to stabilise metal inventories or utilise excess capacity.
The PortfolioDirect cyclical
guideposts suggest that the best possible macroeconomic circumstances for
the resources sector will involve a sequence of upward revisions to
global growth forecasts, the term structure of metal prices once again
reflecting rising near term shortages, a weakening US dollar, strong money
supply growth rates and positive Chinese growth momentum. Only one of the five guideposts is "set to green"
(after the most recent adjustments in July 2017) suggesting the sector remains confined
to near the bottom of the cycle.

Has Anything Changed? - Updated View
From mid 2014, the metal market cyclical position was characterised as ‘Trough Entry’ with all but one of the PortfolioDirect cyclical guideposts - the international policy stance - flashing ‘red’ to indicate the absence of support.
Through February 2016, the first signs of cyclical improvement in nearly two years started to emerge. The metal price term structure reflected some moderate tightening in market conditions and the guidepost indicator was upgraded to ‘amber’ pending confirmation of further movement in this direction.
As of early December 2016, the Chinese growth momentum indicator was also upgraded to amber reflecting some slight improvement in the reading from the manufacturing sector purchasing managers index. Offsetting this benefit, to some extent, the policy stance indicator was been downgraded from green to amber.
The most recent change in cyclical guidepost positioning has been at the end of July 2017 when the exchange rate guidepost was upgraded to green.
Cyclical Position
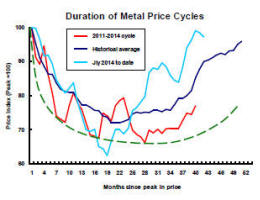
Thirty seven months after their peak, metal prices should have passed their nadir and be heading higher, as they are.
Time, of itself, is not important but the sequence of adjustments which contribute to higher prices and changed expectations take time.
Currently, prices are running ahead of average historical outcomes suggesting scope for a pullback closer to the average outcomes over the past 60 years.
A pullback is not a necessary outcome but an alternative result would most likely require some combination of higher growth, further U.S. dollar weakness or a period of more supportive monetary policies.
There is no assurance presently that any of those three factors will favour the cycle progressing significantly beyond its present position.
The balance of risks suggests a more moderate appreciation in metal prices.
Global Growth - Forecast Revisions
Improved mining industry fortunes now depend on Donald Trump skillfully husbanding tax cuts through the US Congress, Theresa May adeptly negotiating a favourable Brexit pact and Xi Jinping cutting back runaway lending while sustaining Chinese growth.
Final judgments about all three of these tasks nears but remain outstanding.
The IMF announced on 10 October that it had raised its forecast for global growth in 2017 to 3.6% from 3.4% at the time of the corresponding forecast round last year and after a 3.2% expansion of the global economy in 2016.
The Fund’s upgrade of the global growth outlook
ostensibly contained some of the best news for the mining industry since
2010.

The strongest increases in metal usage typically occur when global GDP growth is accelerating.
Rising growth projections are usually a prompt for strategists to raise sectoral fund allocations.
The change for 2017 - the largest upgrade since an initial forecast of 4.5% in 2013 - follows a succession of negative revisions.
The good news is that the macroeconomic risk profile has shifted significantly in favour of the mining industry.
The not so good news is that 2017 is nearly as good as it gets, in the eyes of the Fund. The positive momentum on which strengthening growth in raw material demand relies is almost nonexistent.
Among the advanced economies, growth by 2022 is expected to be 0.5 percentage points lower than in 2017 as economic slack is eliminated.
Chinese growth is expected to decline by a full percentage point.
Any global growth improvement is expected to come entirely from emerging market economies outside China in Latin America, the Middle East and sub-Saharan Africa.
In his budget speech this month, UK Chancellor of the Exchequer Philip Hammond indirectly addressed one of the biggest challenges confronting the global mining industry.
Chinese steel production is set to decline in 2017
according to the monthly production statistics from the World Steel
Association.
Production in the first 11 months of 2017 is running 4.2% below production over the same period of 2016, according to the Association.
The adjacent chart (with an estimate for 2017 in light blue) three phases in the modern history of steel production in China - the gradual build-up through the last decades of the 1900s, the explosive burst in production between 2002 and 2013 which drove demand for raw materials and, since then, relatively stable output as underlying economic activity has been only just sufficient to hold output steady.
The restructuring of the Chinese economy with the resulting contraction in the contribution to Chinese GDP of investment spending will have a generally detrimental effect on raw material demand.
Some will point to China's Belt and Road investment initiatives as more than compensating for the more subdued Chinese domestic demand for metals.
Speaking in June 2017, BHP’s chief commercial officer said China’s B&R infrastructure initiative “is expected to trigger huge demand for resources”.
One participant at the International Mining and Resources Conference in Melbourne in November spoke forcefully about the impact on metal markets from an estimated US$70 billion a year being spent on B&R infrastructure.
Seemingly big numbers, taken out of context, can easily exaggerate the importance of the impending windfall for the mining industry.
International Monetary Fund data suggests Chinese investment spending made up 42% of the country’s GDP in 2016 or 31.5 trillion yuan.
In other words, US$70 billion would amount to only 1.5% of China’s current capital spending and only 0.6% of its GDP which is expanding ten times faster.
Over 2002-10, each US$1 billion in China’s incremental investment spending came with extra apparent consumption of 190,000 tonnes.
In a global context, US$70 billion a year is not an especially big number. China’s experience implies a one-off increase in global steel usage of less than 1% from such an annual spending rate.
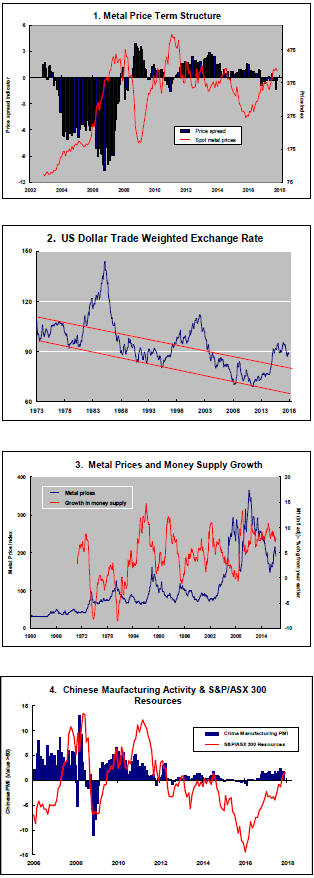
US Dollar Exchange Rate- Chart 2
Much of the recent upward trajectory in metal prices through 2017 has been contributed by a weaker U.S. dollar.
The currency adjustment reflected some reappraisal of relative growth rates and the direction and pace of interest rate changes.
In particular, a rethink occurred about the length of the lag between the U.S. Federal Reserve beginning to tighten its monetary policies and the European Central Bank going down the same path.
Expectations having been reset, a need for further changes in the exchange rate have probably receded. That would leave metal prices with one less leg of support.
With the prospect of a fiscal filip to the U.S. economy in 2018 and 2019 from tax cuts, a move higher in the U.S. dollar becomes a stronger possibility although doubts about whether an agreement is achievable could create some exchange rate volatility in the coming weeks.
Fears of no agreement could easily precipitate a large currency fall although Republicans are likely to avoid this possibility to ensure that they can point to at least one legislative success since gaining nominal control of the Congress.
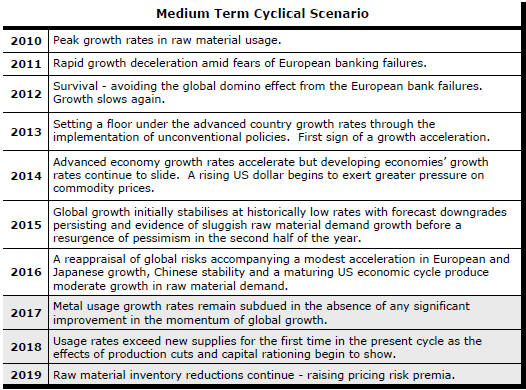
International Policy Stance - Chart 3
Global monetary policies had been set to support higher asset prices as a step toward raising demand and creating stronger employment markets.
While the emphasis on these policies is being reduced as growth becomes more self sustaining, monetary accommodation remains historically strong.
Metal prices are affected by monetary conditions with a lag of several quarters so that there is no imminent threat from future winding back in monetary support but the prospective trajectory of monetary policy will be a source of eventual downward pressure on metal prices.
As some of the most favourable monetary conditions in modern history are wound back, the mining industry will be relying more heavily on output growth and, for that, on the policy dexterity of Messrs Trump, Xi and May.
Metal Price Term Structure - Chart 1
Some modest tightening in nonferrous metal price spreads has been occurring over the past several months driven by emerging backwardations in London Metal Exchange lead and zinc prices.
The tightening in spreads is modest by the standards of what might be possible but overall physical market balances do not appear to be changing enough for the shift in premiums to move more dramatically.
The International Copper Study Group (ICSG) has reported that demand for the metal in the eight months to August 2017 had changed little from the corresponding period of 2016.
The ICSG has estimated that there was a slight increase in global metal inventories between the end of August 2016 and the end of August 2017.
The International Lead Zinc Study group has reported that zinc usage in the first nine months of 2017 increased by only 0.7%, well below the 3%-plus historical rates of zinc consumption growth.
The unusually weak expansion in zinc usage has coincided with lowered metal production after mine output fell in 2016. The changing production profile has helped constrain the inventory build that might have otherwise occurred.
With only moderately increasing or falling rates of usage across the major daily traded metals, relatively narrow metal price spreads may indicate market conditions are insufficiently strong to carry the cycle significantly further.
Chinese Growth Momentum - Chart 4
Current Chinese growth rates remain highly
dependent on the accommodative lending policies of the central government.

The dependence on financial leverage comes despite widespread agreement that the flow of funds is unsustainable and creating longer term distortions which will need addressing.
Signs of Xi Jinping wishing to consolidate his position as preeminent leader of the country have led to inferences that ‘good’ economic outcomes were contrived in the lead-up to the national congress of the Chinese communist party.
Now that the politics is apparently out of the way and the central committee can focus more fully on longer term economic issues, greater control over monetary conditions is expected.
There is no prospect of more accommodating policy settings than have been in place for the past several years being implemented giving any cyclical risks for raw material markets a bias to the downside.
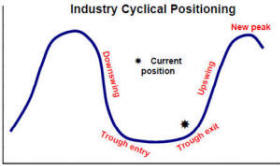 The chart illustrates the cyclical classifications used to define the positioning of the metal markets. The
cyclical positioning informs recommendations about the allocation of funds within the sector.
The chart illustrates the cyclical classifications used to define the positioning of the metal markets. The
cyclical positioning informs recommendations about the allocation of funds within the sector.