The Current View
Growth in demand for raw materials peaked in late 2010. Since then, supply growth has continued to outstrip demand leading to inventory rebuilding or spare production capacity. With the risk of shortages greatly reduced, prices have lost their risk premia and are tending toward marginal production costs to rebalance markets.
To move to the next phase of the cycle, an acceleration in global output growth will be required to boost raw material demand by enough to stabilise metal inventories or utilise excess capacity.
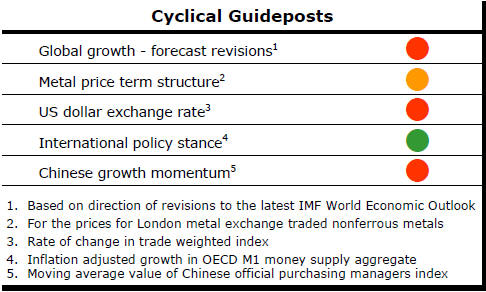
The PortfolioDirect cyclical
guideposts suggest that the best possible macroeconomic circumstances for
the resources sector will involve a sequence of upward revisions to
global growth forecasts, the term structure of metal prices once again
reflecting rising near term shortages, a weakening US dollar, strong money
supply growth rates and positive Chinese growth momentum. Only one of
the five guideposts is "set to green" suggesting the sector remains confined
to the bottom of the cycle .
Has Anything Changed? - Updated View
Since mid 2014, the metal market cyclical position has been characterised as ‘Trough Entry’ as prices have remained in downtrend with all but one of the PortfolioDirect cyclical guideposts - the international policy stance - flashing ‘red’ to indicate the absence of support.
The absence of a global growth acceleration, a stronger dollar and flagging Chinese growth momentum remain critical features of the current cyclical positioning.
Through February 2016, the first signs of cyclical improvement in nearly two years started to emerge. After 15 months of contango, the metal price term structure shifted to backwardation reflecting some moderate tightening in market conditions.
The metal price term structure is the most sensitive of the five cyclical guideposts to short term conditions and could, consequently, quickly reverse direction. Nonetheless, this is an improvement in market conditions and the guidepost indicator has been upgraded to ‘amber’ pending confirmation of further movement in this direction.
Growth Downgrades to Come
The macro backdrop to the sector remains much the same with no reason to
expect the change in the global growth environment that would contribute
toward a stronger cyclical upturn.
Over time, metal supply growth slows in response to
weaker economic conditions but usually not by enough, on its own, to
precipitate improved cyclical conditions. The rate of metal inventory
accumulation is less strong but, with only a few exceptions, remains headed
in the wrong direction.
In an interview with Reuters prior to the G20 leaders meeting in China, International Monetary Fund head Christine Lagarde foreshadowed a further cut in the group’s global growth forecasts after a lengthy succession of downward revisons. The next release of forecasts is scheduled for October.
The UK vote to exit the European Union has not had the emphatic negative impact on growth or markets foreshadowed beforehand or expected immediately after the vote was concluded.
World Trade New Source of Weakness
On the other side of the ledger, the IMF is now more concerned about a
slowdown in the growth in world trade. China, Europe, Japan and, to a
lesser extent, the USA rely on trading opportunities to break the
constraints imposed by their own domestic economies to spur better growth
outcomes.
A vibrant trade in goods also helps productivity improvements. Strong trade growth can create a beneficial feedback loop which stimulates further trade and improves the global growth profile.
One indicator of the parlous state of global trade is the bankruptcy of the third largest Korean shipping company. Hanjin, one of the world’s seven largest container shipping groups, is a victim of the trade slowdown.
The bankruptcy has wider implications for economic outcomes. There is some risk of it disrupting domestic sales of goods over the Christmas trading period in North America and Europe if ships are prevented from unloading because shipowners and their agents cannot pay port handling costs.
IMF officials will be seeking to persuade G20 leaders meeting in China that efforts to stimulate trade can make an important contribution to the growth outlook. This comes at a time when protectionist pressures are mounting to protect domestic employment and, in response, countries are scrambling to retain their historical shares of slower growing markets.
The G20 meeting also comes after a largely failed attempt initiated two years ago to implement a concerted action plan to spur global growth. Despite attempts to ‘name and shame’ countries failing to live up to their commitments on paper, the impact has been negligible.
Chinese Lending Growth Beats Output
The performance of the Chinese manufacturing sector seemed to have improved
slightly in August. The official survey of purchasing managers (see Chart 4
opposite) implied that output had expanded, albeit weakly. The reading of
50.4 was the strongest recorded since October 2014.
 This
official result, in combination with the privately conducted Caixin monthly
survey of purchasing managers, suggests that the output expansion is more
evident among China’s larger manufacturing companies than at the smaller
end.
This
official result, in combination with the privately conducted Caixin monthly
survey of purchasing managers, suggests that the output expansion is more
evident among China’s larger manufacturing companies than at the smaller
end.
The larger companies are probably better positioned to take advantage of available bank funding although they are also the ones least in need of external financing assistance.
China’s central bank has reported a 12% growth in loans outstanding over the 12 months to July 2016. This is a slowing of the growth rate prevailing over the past several years but still well above the underlying pace of economic activity.
The already large disparity between output growth rates and available finance suggests that the government may achieve little by further monetary policy steps to spur economic activity.
For the time being, at least, the Chinese business sector is sitting on available funds rather than putting them to work by investing in new capacity or productivity enhancing measures.