The Current View
Growth in demand for raw materials peaked in late 2010. Since then, supply growth has continued to outstrip demand leading to inventory rebuilding or spare production capacity. With the risk of shortages greatly reduced, prices have lost their risk premia and are tending toward marginal production costs to rebalance markets.
To move to the next phase of the cycle, an acceleration in global output growth will be required to boost raw material demand by enough to stabilise metal inventories or utilise excess capacity.
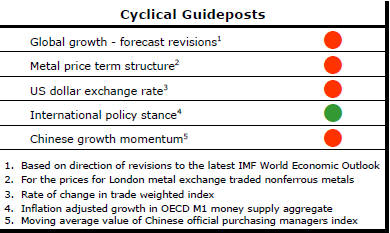
The PortfolioDirect cyclical
guideposts suggest that the best possible macroeconomic circumstances for
the resources sector will involve a sequence of upward revisions to
global growth forecasts, the term structure of metal prices once again
reflecting rising near term shortages, a weakening US dollar, strong money
supply growth rates and positive Chinese growth momentum. Only one of
the five guideposts is "set to green" suggesting the sector remains confined
to the bottom of the cycle .
Has Anything Changed?
Throughout 2014, PortfolioDirect had been characterising the cyclical position as ’Trough Entry’ with some expectation that by the end of 2014 an exit would be evident. Until very late in the year, the evidence supported that possibility before conditions took several backward steps.
The absence of a growth acceleration among the major economic regions is contributing to the flagging momentum. A stronger US dollar is also imparting a downward bias to US dollar denominated prices presently.
This change has been enough to define a fresh cycle and a more prolonged adjustment process.
Steel Production Slips Lower
The World Steel Association has reported that crude steel production was
2.3% lower over the first eight months of 2015 than over the corresponding
period of 2014. 
The lower production confirms the slower growth trajectory of the global economy about which investors have been worrying for some months. Despite the numbers confirming the validity of a slower growth assumption, the deceleration is proving relatively modest (and far tamer than the volatility in equity markets may suggest).
While much of the focus of markets has been on China, the rest of the world is losing just as much steel output. Chinese steel production, which accounts for about 50% of the global total, has declined 1.5%, according to the Association. Production outside China has declined 3.0%.
Mine Supplies Keep Rising
The zinc industry keeps defying predictions of production losses from mine
closures and a rapid rundown in available inventories.
According to the International Lead Zinc Study Group, mine production was 6.4% higher over the first seven months of 2015 than over the corresponding period of 2014. Metal production was 8.4% higher. Usage increased by only 2.9%.
There will have been some tendency for mines coming to the end of their productive lives to have as much production pushed out as quickly as possible. At the same time, there will have been a tendency for analysts to underestimate production by focusing on the biggest and most conspicuous changes while neglecting the dozens of small adjustments which, when combined, can have a meaningful impact on market balances.
The copper market is showing similar tendencies. Mine output over the first six months of 2015 was 3.1% higher, according to the International Copper Study Group. Metal production was up 3.2%. Estimated metal usage was 2.2% lower than in the corresponding period of 2014.
The variations in output and usage rates are still within the bounds of an evenly balanced market. The statistics are also consistent with the tendency of miners to up their production when prices fall, in the first instance, to keep unit costs as low as possible so as to sustain margins and maximise cash flow.
Euro Money Supply Growth Stalls
The Euro area money supply (M3) growth rate has lost its upward momentum. 
Policy remains broadly supportive of an expansion in activity but the slackening pace of money supply growth from 2-2½% a month during the first quarter of 2015 to 1.0-1.1% a month for the last several months must raise some doubts about whether enough is being done.
Certainly, money supply will grow fastest if demand for funds is also on the rise as it was during the 2000s until 2008. The current money supply growth trajectory suggests that Europe's central bank may be doing its bit but that the real economy is not yet responding in a way which is consistent with a significant improvement in growth prospects beyond recent outcomes.