The Current View
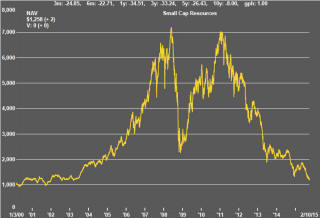
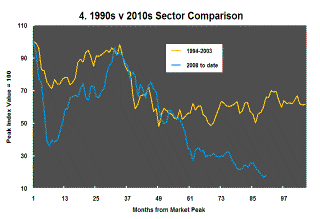
A lengthy downtrend in sector prices had given way to a relatively stable trajectory after mid 2013 similar to that experienced in the latter part of the 1990s and first few years of the 2000s.
The late 1990s and early 2000s was a period of macroeconomic upheaval during which time sector pricing nonetheless proved relatively stable. That remains a possible scenario for sector prices.
Relative stability suggests a chance for companies genuinely adding value through development success to see their share prices move higher. This was the experience in the late 1990s and early 2000s.
The lower equity prices fall - and the higher the cost of capital faced by development companies - the harder it becomes to justify project investments. The market is now entering a period prone to even greater disappointment about project delivery .
Has Anything Changed?
The assumption that June 2013 had been the cyclical trough for the market was premature.
Sector prices have adjusted to the next level of support. The parallel with the 1990s illustrated in Chart 4 is being tested. Prices will have to stabilise around current levels for several months for the thesis to hold.
Key Outcomes in the Past Week
US equity prices traversed historic ranges on Friday as
investors tried to digest what was happening to the U.S. economy.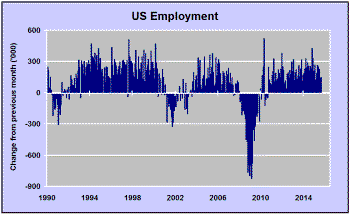
The monthly labour force data released on Friday showed a 142,000 increase in the number of nonfarm employees in September. For the first time since mid 2012, the US reported two consecutive months in which the monthly employment increase had been less than 150,000. The much watched wages data showed a similar picture. Average hourly earnings did not increase in the month and remained just 1.9% higher than a year earlier.
The labour statistics hinted at, even if they did not confirm, an economy in the midst of a slowdown.
The S&P 500 fell 1.5% as markets opened, reportedly on very low volumes and presumably driven by an inference from the labour force numbers about the future trajectory of corporate profits.
Such is the extent of the U.S. market schizophrenia that, within the hour, prices were on their way to closing 3.0% higher than where they had been trading in the morning.
The upswing prompted comparisons with the drug addict looking for another dose of codeine. A weak labour market would mean the Federal Reserve being less likely to raise interest rates in the near term even leaving an outside chance of a fourth round of quantitative leasing in 2016 as policymakers desperately try to reflate a sagging economy.
Friday’s labour statistics and the market reaction reinforce the thrust of the PortfolioDirect commentaries in the past two weeks which have highlighted how the Fed is out of sync with the economy as it moves to raise interest rates when, normally, there would be pressure to get them down.
Importantly for the resources sector, the US dollar took a hit from the change in interest rate expectations. Gold prices rose 2.0% and industrial commodity prices moved higher through the day.
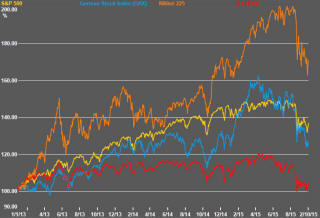
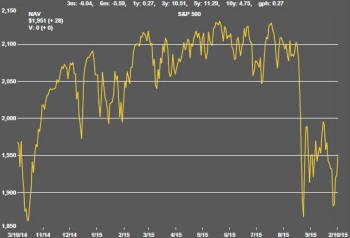 There
is nothing in these market movements to suggest a permanent change in
direction. The chart of the S&P 500 opposite illustrates the intense
choppiness of the market over the past year as it has tried to find a sense
of direction without firm positive guidance from its usual sources,
including global economic growth, corporate profits or economic policy. As
long as that remains the case, more days like Friday are on the cards.
There
is nothing in these market movements to suggest a permanent change in
direction. The chart of the S&P 500 opposite illustrates the intense
choppiness of the market over the past year as it has tried to find a sense
of direction without firm positive guidance from its usual sources,
including global economic growth, corporate profits or economic policy. As
long as that remains the case, more days like Friday are on the cards.
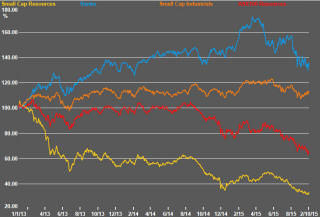
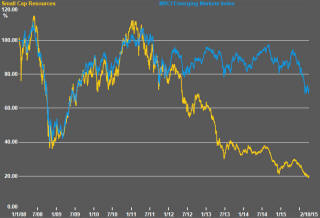
Australia’s small resources share price index showed a glimpse of strength and some building evidence of the beginnings of a potential cyclical transition away from the larger cap companies in favour of the smaller end of the market.
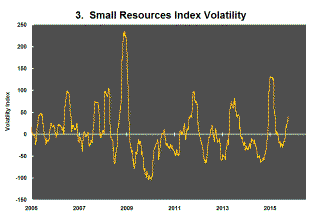
The index of small resources stock prices rose 1.7% over the week while the S&P/ASX 100 resources index dropped 1.6%. Australian sector volatility continues to rise flagging ongoing downside risk to the market. The Euromoney Global Mining Index (formerly the HSBC Global Mining Index) lost 2.0% over the first four days of the week although it had already started to move higher after the manufacturers purchasing managers index from the Chinese government had not fallen by as much as some had expected. In any event, whatever improvement there might have been leaves the international index, along with the Australian market, firmly on a downtrend toward historically low levels.
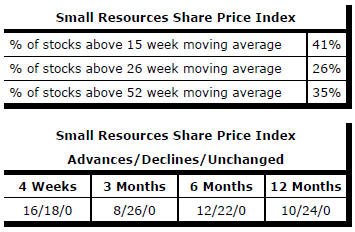
Market Breadth Statistics