The Current View
Growth in demand for raw materials peaked in late 2010. Since then, supply growth has continued to outstrip demand leading to inventory rebuilding or spare production capacity. With the risk of shortages greatly reduced, prices have lost their risk premia and are tending toward marginal production costs to rebalance markets.
To move to the next phase of the cycle, an acceleration in global output growth will be required to boost raw material demand by enough to stabilise metal inventories or utilise excess capacity.
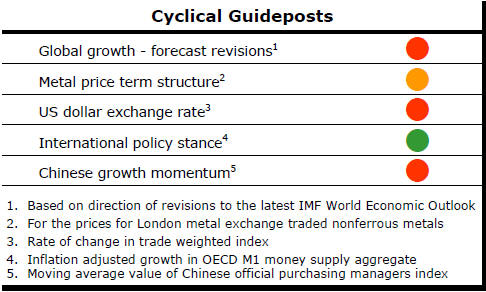
The PortfolioDirect cyclical
guideposts suggest that the best possible macroeconomic circumstances for
the resources sector will involve a sequence of upward revisions to
global growth forecasts, the term structure of metal prices once again
reflecting rising near term shortages, a weakening US dollar, strong money
supply growth rates and positive Chinese growth momentum. Only one of
the five guideposts is "set to green" suggesting the sector remains confined
to the bottom of the cycle .
Has Anything Changed? - Updated View
Since mid 2014, the metal market cyclical position has been characterised as ‘Trough Entry’ as prices have remained in downtrend with all but one of the PortfolioDirect cyclical guideposts - the international policy stance - flashing ‘red’ to indicate the absence of support.
The absence of a global growth acceleration, a stronger dollar and flagging Chinese growth momentum remain critical features of the current cyclical positioning.
Through February 2016, the first signs of cyclical improvement in nearly two years started to emerge. After 15 months of contango, the metal price term structure shifted to backwardation reflecting some moderate tightening in market conditions.
The metal price term structure is the most sensitive of the five cyclical guideposts to short term conditions and could, consequently, quickly reverse direction. Nonetheless, this is an improvement in market conditions and the guidepost indicator has been upgraded to ‘amber’ pending confirmation of further movement in this direction.
Balance of Probabilities Points to Metal Price
Downside
PortfolioDirect metal price forecasting models rely on two pillars: changes
in physical market balances and exchange rate movements.
Physical market balances, in turn, have been a function of global growth momentum. Accelerating growth has usually accompanied periods of the strongest metal usage and shrinking inventories.
Since the U.S. dollar has largely been in a downtrend over the 40-50 years since the early 1970s, a judgment about global growth has usually been sufficient to draw inferences about changes in the direction of prices. For convenience, and sometimes out of ignorance, the exchange rate effect has been ignored.
Between mid-2014 and the end of 2015, the U.S. dollar exchange rate index rose by a little over 20%. Over the same period, the International Monetary Fund metal price index fell by 38%, an outcome consistent with the historical correlation.
Over the period from 1973 to 2015, a rise in the exchange rate of 8% or more has been accompanied by metal price declines, as measured by the index, averaging 17%. Exchange rate declines of 5% or more have come with a metal price rise averaging 19%.
Since the end of 2015, the U.S. dollar had fallen by as much as 6.1% but has also since recovered as much as 3.5%.
As these movements have occurred, metal prices have responded and sector equities have reacted accordingly. Consequently, the average increase in the prices of the main nonferrous metals was 12.4% as the currency was dropping and the Euromoney global mining index leveraged to these conditions, for example, added 47%.
The improved market tone has been exchange rate driven without any significant improvement in global growth momentum.
There are sound reasons to believe the growth picture will change little during the remainder of 2016. To the extent there are risks to the growth outlook, they are on the downside. Few, if any, forecasters are worried about an unexpectedly strong surge in growth anytime soon.
Against this backdrop, metal markets appear likely to remain dominated by exchange rate fluctuations. More than usually, this means a heavy dependence on central bank decision-making as monetary policies among the Chinese, Japanese, European and U.S. central banks dictate what happens to exchange rates.
Just as important as the central bank decisions themselves are what investors expect the decisions to be and how these expectations change from time to time. From a U.S. dollar perspective, there are three potential scenarios.
-
The exchange rate may change little but fluctuate materially as expectations of monetary policy changes ebb and flow.
-
The U.S. dollar may resume an upward trend as the Federal Reserve makes good on its promise to normalise policy settings and, related to that, as U.S. growth outpaces growth outcomes in the rest of the world.
-
The U.S. dollar falls as policy settings in China, Japan and Europe start to produce better growth and inflation outcomes.
Presently, the third of these scenarios appears the least likely. The second seems marginally more likely than the first. Assigning probabilities of 30/50/20 might be appropriate (although views on the precise numbers will differ).
The allocated probabilities suggest that conditions most conducive to higher metal prices are the least likely. The chance of conditions fostering falling or stable prices is as high as 80%.
Attempting to quantify the outcomes in this way might imply a spurious degree of analytical precision but serves to encapsulate a view about the cyclical condition of metal markets in the absence of any material change in the pattern of growth.
Anyone attempting to think about the direction of metal prices and, consequently, sector equity prices needs to go through such an exercise, at least implicitly, to validate conclusions about the likely direction of metal prices over the next 12-18 months. .