The Current View
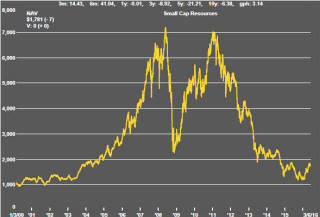
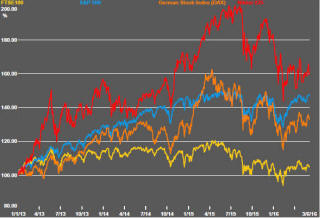
A lengthy downtrend in sector prices had given way to a relatively stable trajectory after mid 2013 similar to that experienced in the latter part of the 1990s and first few years of the 2000s.
The late 1990s and early 2000s was a period of macroeconomic upheaval during which time sector pricing nonetheless proved relatively stable. That remains a possible scenario for sector prices.
Relative stability suggests a chance for companies genuinely adding value through development success to see their share prices move higher. This was the experience in the late 1990s and early 2000s.
The lower equity prices fall - and the higher the cost of capital faced by development companies - the harder it becomes to justify project investments.
Has Anything Changed?
A 1990s scenario remains the closest historical parallel although the strength of the US dollar exchange rate since mid 2014 has added an unusual weight to US dollar prices.
The first signs of cyclical stabilisation in sector equity prices have started to show. This has meant some very strong ‘bottom of the cycle’ gains but only after prices have already fallen by 70% or more in many cases leaving prices still historically low.
Funding for project development may have passed its most difficult phase at the end of 2015 with signs of deals being done and evidence that capital is available for suitably structured transactions.
Key Outcomes in the Past Week
Trying to guess which way the U.S. Federal Reserve will jump has again been an important influence on sector equity prices.
On Friday, the U.S. government reported that an additional 38,000 nonfarm jobs had been created in May, a number well below what had been expected by forecasters and well down on numbers in recent months.
Of course, the May data point alone is hardly a
trend but the signs are ominous when combined with a downward revision to
the April data. Last week’s data is also consistent with there being a
lagged employment effect from a slowdown in output growth.
The chart shows a three month moving average for the monthly U.S. non-farm payroll data. The average has been declining since December suggesting a momentum change has been underway for several months rather than the May data being a one-off statistical outlier.
For several months, the U.S. economy had been throwing off mixed signals. Employment growth seemed inconsistently strong when set against flagging output growth. Many forecasters had inferred from the flow of numbers that growth would rise to match the employment data. The adjustment is occurring but in the opposite direction to what had been expected.
The seeming confirmation of slower growth outcomes once again throws doubt over the likelihood of a June or July interest rate rise just as recent speeches by Federal Reserve governors appeared a concerted effort to prime the market for an imminent change.
The new data point may not be enough to divert Federal Reserve governors from their determination to normalise policy settings but, at a minimum, it is likely to reignite uncertainty about the conduct of policy and debate about how the Fed governors are interpreting the uneven flow of economic statistics.
From a resources sector perspective, Friday’s employment data was highly significant. The U.S. dollar dropped 1.6% and gold prices rose $33/oz or 2.7%. Prices of the most sensitive nonferrous metals such as copper also rose on the last trading day of the week helping to push sector equity prices higher. The Euromoney global mining index rose 5.4% on Friday and the Market Vectors Gold Miners ETF increased 11.2%.
Expectations about interest rates are now changing frequently leaving equity prices vulnerable to equally frequent adjustments such as those that occurred on Friday making it a mistake to conclude that large equity price moves are connected to a change in cyclical conditions.
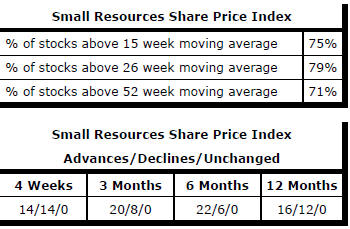
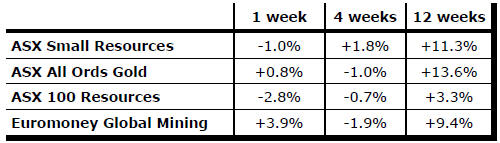
Market Breadth Statistics