The Current View
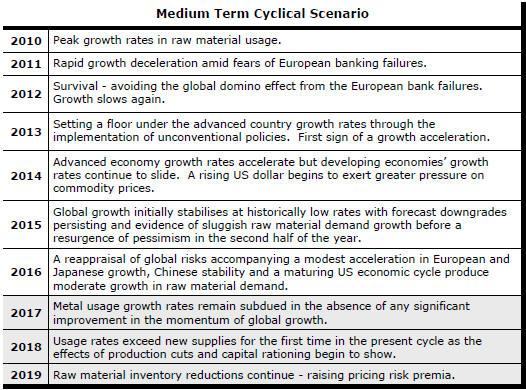
Growth in demand for raw materials peaked in late 2010. Since then, supply growth has generally outstripped demand leading to inventory rebuilding or spare production capacity. With the risk of shortages greatly reduced, prices lost their risk premia and have been tending toward marginal production costs to rebalance markets.
The missing ingredient for a move to the next phase of the cycle is an acceleration in global output growth which boosts raw material demand by enough to stabilise metal inventories or utilise excess capacity.
The PortfolioDirect cyclical
guideposts suggest that the best possible macroeconomic circumstances for
the resources sector will involve a sequence of upward revisions to
global growth forecasts, the term structure of metal prices once again
reflecting rising near term shortages, a weakening US dollar, strong money
supply growth rates and positive Chinese growth momentum. Only one of the five guideposts is "set to green"
(after the most recent adjustments in July 2017) suggesting the sector remains confined
to near the bottom of the cycle.

Has Anything Changed? - Updated View
From mid 2014, the metal market cyclical position was characterised as ‘Trough Entry’ with all but one of the PortfolioDirect cyclical guideposts - the international policy stance - flashing ‘red’ to indicate the absence of support.
Through February 2016, the first signs of cyclical improvement in nearly two years started to emerge. The metal price term structure reflected some moderate tightening in market conditions and the guidepost indicator was upgraded to ‘amber’ pending confirmation of further movement in this direction.
As of early December 2016, the Chinese growth momentum indicator was also upgraded to amber reflecting some slight improvement in the reading from the manufacturing sector purchasing managers index. Offsetting this benefit, to some extent, the policy stance indicator was been downgraded from green to amber.
The most recent change in cyclical guidepost positioning has been at the end of July 2017 when the exchange rate guidepost was upgraded to green.
Guideposts Upgraded
The resources industry remains within a prolonged cyclical trough.
The balance of risks has changed over the past two years as the most obvious potential global economic shocks have been avoided. Principal among those was the potential for a systemic failure of European financial institutions, possibly precipitated by a Greek debt default.
For many months, the five PortfolioDirect cyclical indicators have been flashing “amber” suggesting that the worst had passed but that any improvement had not been sufficient for a more aggressive upgrading.
US Dollar
Among the five cyclical guideposts, the most dramatic change has come from
the changed direction in the U.S. dollar which is now close to the lowest
levels in 30 months.
The fall still leaves the currency more than 15% above where it had been in mid-2014 opening the possibility of a still more dramatic decline.
The argument for ongoing U.S. dollar strength had rested on superior U.S. growth outcomes being accompanied by the Federal Reserve leading global interest rates higher.
In practice, the growth picture is less clear cut with doubts rising about the capacity of the new Trump administration to affect growth outcomes while growth in Europe has improved sufficiently for the policy discussion to turn to when monetary accommodation might be reduced rather than whether there is a need for more policy easing.
Forecasts Revisions
The International Monetary Fund has once again updated its national economic
forecasts for 2017 and 2018 without making any significant change to the
overall outcome.
Over several reviews, the Fund has found itself compensating for pockets of stronger than expected growth with offsetting weakness elsewhere.
The volatility in its national global growth forecasts has reflected some propensity for the Fund to extrapolate short term influences too quickly.
The promise of the new Trump administration in the USA to spur growth through a stronger fiscal stimulus was promptly built into Fund forecasts. With the legislative effectiveness of the new team now in doubt, the Fund has wound back its growth estimates for the USA.
At the same time, the Fund had been reacting to the statements of Chinese leaders about reducing reliance on investment spending as a source of growth by modestly cutting the country’s GDP growth forecasts. In this case, with the Chinese not having been as aggressive as expected, the Fund has had to raise its forecasts.
Similarly, in line with the consensus among economists for a slump in growth in the event UK electors voted to leave the European Union, the Fund cut back its UK growth forecast. That also had to be reversed after growth proved significantly more robust than anticipated.
Overall, output growth has become less volatile but, with a succession of offsetting adjustments, there has been little net positive momentum. This has also left the mining industry without significant incentive to more aggressively raise output levels.
A need to upgrade global growth forecasts would be a highly positive sign for the resources industry because it would signal the rising possibility of a level of demand for raw materials to which the industry had failed to adjust.
Metal Price Term Structure
The term structure of metal prices has tightened in recent months but the
change has been patchy without an evident trend to suggest day to day
traders are witnessing a rising risk of shortages.
Policy Stance
Monetary conditions remain broadly supportive of higher metal prices insofar
as the growth rate in money supply continues to outstrip inflation by a
historically large margin although the diminishing momentum in money supply
growth rates is the reason for an “amber” guidepost rating presently.
Chinese Growth
Within China, the largest single national market for metals, manufacturing
has been expanding, according to the official purchasing managers index used
as the basis for the fifth of the PortfolioDirect cyclical guideposts.
The extent of the expansion has been relatively modest with very limited positive momentum to help lift sentiment. In this case, too, the guidepost now has a neutral rating.
Overall, the cyclical position has improved but only very modestly to this point leaving the sector to crawl along the bottom of a prolonged cyclical trough.
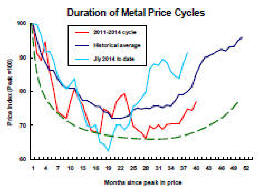
The metal price action, from a timing perspective, is consistent with the historical experience insofar as prices have been firming when history suggests that should be happening.
The sector is closer to the point of trough exit but the cyclical guideposts are pointing to insufficient momentum to carry the process toward a more wholehearted cyclical rise. .