The Current View
Growth in demand for raw materials peaked in late 2010. Since then, supply growth has continued to outstrip demand leading to inventory rebuilding or spare production capacity. With the risk of shortages greatly reduced, prices have lost their risk premia and are tending toward marginal production costs to rebalance markets.
To move to the next phase of the cycle, an acceleration in global output growth will be required to boost raw material demand by enough to stabilise metal inventories or utilise excess capacity.
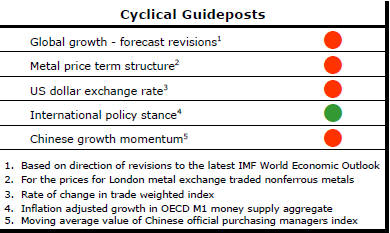
The PortfolioDirect cyclical
guideposts suggest that the best possible macroeconomic circumstances for
the resources sector will involve a sequence of upward revisions to
global growth forecasts, the term structure of metal prices once again
reflecting rising near term shortages, a weakening US dollar, strong money
supply growth rates and positive Chinese growth momentum. Only one of
the five guideposts is "set to green" suggesting the sector remains confined
to the bottom of the cycle .
Has Anything Changed?
Throughout 2014, PortfolioDirect had been characterising the cyclical position as ’Trough Entry’ with some expectation that by the end of 2014 an exit would be evident. Until very late in the year, the evidence supported that possibility before conditions took several backward steps.
The absence of a growth acceleration among the major economic regions is contributing to the flagging momentum. A stronger US dollar is also imparting a downward bias to US dollar denominated prices presently.
This change has been enough to define a fresh cycle and a more prolonged adjustment process.
Slowing Growth Still the Problem
Slackening growth remains the dominant theme in the global economy. From a
resources sector viewpoint, the theme implies a more prolonged cyclical
adjustment and a reduced chance of a strong price recovery in the
foreseeable future.
The meeting of G20 finance ministers in Ankara, under the chairmanship this year of Turkey, appeared less committed to the Brisbane leaders’ goal last year to lift global growth by two percentage points by 2018. Expectations of this goal being met were low from the beginning, in any event. Consequently, disappointment will not run high but the lack of follow through would be a lost opportunity for the mining industry and one of the few sources of assistance that may be available to improve its outlook over the next three to five years.
Speaking after the G20 meeting, the International Monetary Fund managing director, Christine Lagarde, referred to the downside risks to growth as having increased, particularly for the emerging market economies.
The IMF continues to forecast some pickup in global growth in the year ahead but the expected acceleration appears increasingly modest. The absence of any meaningful acceleration is another blow to the fortunes of the world’s miners.
The IMF has highlighted the need to do more to meet the
Brisbane growth commitments. The IMF and OECD are both due to report
progress on the commitments in November, keeping alive some faint home of
government policies yet contributing positively to growth. 
The OECD leading economic indicators continue to highlight the broad tendencies among the principal economic regions. The indicators illustrated in the chart show a slowing G7 grouping, a more sharply declining China and a recovering India as the sole source of positive global momentum.
Within the advanced economies, Europe is showing signs of a slight acceleration during the balance of 2015 but the USA and Japan are positioned for further slackening in their rates of growth.
The IMF is scheduled to publish its regular economic forecast revisions in October. Its recent commentary suggests further downgrades are on the cards leaving the PortfolioDirect growth revision indicator, used as one ingredient in its assessment of cyclical positioning, flashing red.
The term structure of metal prices (Chart 1) also remains consistent with price weakness. The official Chinese manufacturing purchasing managers index (Chart 4) remains very close to its “breakeven” reading of 50 but has slipped below the expansion/correction benchmark creating additional anxiety about the extent of a Chinese economic slowdown and the ability of that economy to recover lost output within a reasonable time frame.
While monetary settings (Chart 3) remain generally supportive of activity, central banks have been able to affect asset prices without being able to have anywhere near as meaningful an impact on productivity and growth. .