The Current View
Growth in demand for raw materials peaked in late 2010. Since then, supply growth has continued to outstrip demand leading to inventory rebuilding or spare production capacity. With the risk of shortages greatly reduced, prices have lost their risk premia and are tending toward marginal production costs to rebalance markets.
To move to the next phase of the cycle, an acceleration in global output growth will be required to boost raw material demand by enough to stabilise metal inventories or utilise excess capacity.
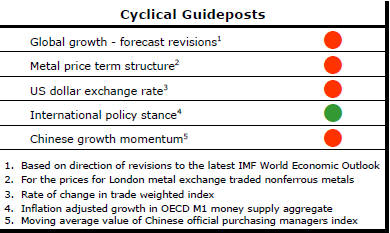
The PortfolioDirect cyclical
guideposts suggest that the best possible macroeconomic circumstances for
the resources sector will involve a sequence of upward revisions to
global growth forecasts, the term structure of metal prices once again
reflecting rising near term shortages, a weakening US dollar, strong money
supply growth rates and positive Chinese growth momentum. Only one of
the five guideposts is "set to green" suggesting the sector remains confined
to the bottom of the cycle .
Has Anything Changed?
Throughout 2014, PortfolioDirect had been characterising the cyclical position as ’Trough Entry’ with some expectation that by the end of 2014 an exit would be evident. Until very late in the year, the evidence supported that possibility before conditions took several backward steps.
The absence of a growth acceleration among the major economic regions is contributing to the flagging momentum. A stronger US dollar is also imparting a downward bias to US dollar denominated prices presently.
This change has been enough to define a fresh cycle and a more prolonged adjustment process.
Growth and Exchange Rates - Moving in the Wrong
Direction
The ongoing cyclical positioning of the resources industry
depends on two preeminently important exogenous influences: growth in raw
material demand and exchange rate movements.
Growth in raw material demand remains a function of global growth momentum. Whether growth is accelerating or decelerating - rather than simply the rate of growth - will influence demand outcomes.
Expectations about global output growth rates are being scaled back. The International Monetary Fund, for example, has now forecast that 2016 global GDP growth will reach only 3.4% after having earlier forecast a 3.8% outcome.
This result would still be above the currently estimated 3.1% expansion in 2015 but the size of the improvement has been contracting leading to loss of growth momentum.
The Fund now expects growth to stabilise
below 4% compared with an average outcome of 4.3% over the first nine years
of the 2000s.
The PortfolioDirect raw material demand models suggest that copper demand, for example, will be lower by slightly less than one million tonnes in 2018 based on the newest IMF growth forecasts than it would have been had the 2000-2008 average growth rate been repeated.
Countries have some reasons in common for slower than average growth outcomes, including the contribution of each to the negative feedback loop that acts through trade and financial markets.
There are also reasons peculiar to individual countries. Russia, Brazil, India and Saudi Arabia, for example, are a diverse set of economies all growing more slowly than would have been expected because of varying combinations of structural economic constraints, local politics and international relations.
In each case, different problems constraining productivity need addressing directly through governments and business institutions.
The structural background to the current set of growth outcomes is limiting how quickly raw material demand improvements can occur. Global growth rates anchored at less than 4% imply that metal inventories, in the case of copper, continue to rise for the foreseeable future. There is no near term cyclical upturn.
It does not necessarily follow that metal prices continue to fall as inventories build. The relationship between prices and metal inventories is typically non-linear. An ongoing buildup in inventories pushes prices to the marginal cost of production which acts as a floor for prices. The inventory accumulation ceases to impact the price level past a point but does have an impact on the duration of the cyclical movement.
Inventories could keep building until an improvement in global growth momentum commences. Then, enough time must pass for the market rebalancing to take effect as the accumulated inventories are used.
Slower growth expectations may warrant an adjustment to the outlook for metal usage and some further reappraisal of the duration of the cyclical adjustment that has been underway.
Prices in the future may not be materially more severe than those already experienced but the absence of an improved growth momentum will extend the duration of the cyclical trough beyond that which may have been expected even a few months ago.
Exchange Rates to Disrupt Metal
Pricing
Exchange rates are the product of a
myriad economic and financial market forces. In the longer term, relative
inflation rates often prove influential but, in the near term, relative
interest rate movements assume greater importance.
Interest rate movements, or expectations of future changes, have contributed to the rise in the US dollar since mid 2014. Expected tightening in US monetary policy well ahead of similar policy steps in Europe and Japan has resulted in corresponding anticipatory shifts in exchange rates.
Publicly, the US Federal Reserve remains determined to push ahead with as many as four interest rate rises during 2016. Some commentators have questioned the practicality of this intention with interest rates being pushed lower by other central banks and some evidence of slippage in US economic growth holding back inflation and employment growth.
Exchange rate movements at the end of last week amid signs weakening US activity is reducing the expected upward pressure on US interest rates have reinforced the potential for a lower US dollar exchange rate.
This resulted in some reversal in the cyclical weakening in metal prices that had occurred over the prior month. Investors in the resources sector will have to contend with exchange rate interactions remaining influential as these policy measures play out in the coming year or two. They will affect prices in ways which might have little overt connection with the physical market balances to which most refer in assessing the state of the metal markets.