The Current View
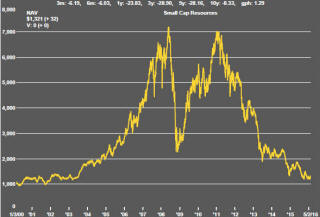
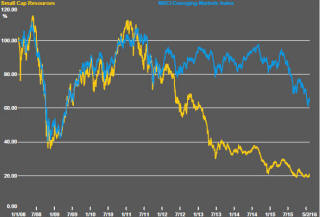
A lengthy downtrend in sector prices had given way to a relatively stable trajectory after mid 2013 similar to that experienced in the latter part of the 1990s and first few years of the 2000s.
The late 1990s and early 2000s was a period of macroeconomic upheaval during which time sector pricing nonetheless proved relatively stable. That remains a possible scenario for sector prices.
Relative stability suggests a chance for companies genuinely adding value through development success to see their share prices move higher. This was the experience in the late 1990s and early 2000s.
The lower equity prices fall - and the higher the cost of capital faced by development companies - the harder it becomes to justify project investments. The market is now entering a period prone to even greater disappointment about project delivery .
Has Anything Changed?
The assumption that June 2013 had been the cyclical trough for the market was premature.
Sector prices have adjusted to the next level of support. The parallel with the 1990s illustrated in Chart 4 is being tested. Prices will have to stabilise around current levels for several months for the thesis to hold.
Key Outcomes in the Past Week
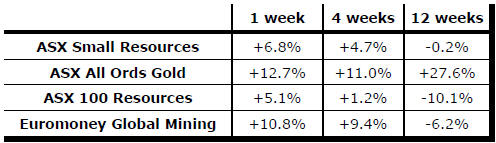
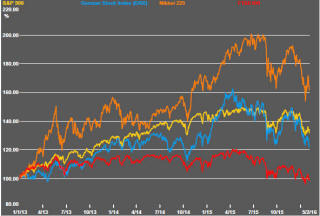
Global equity markets took a hit at the end of the week as growth fears again struck. Conditions appear far more benign presently than at many times in recent years but sources of fresh good news are proving limited and markets had been increasingly priced for success.
The technology space which was savaged after less than ebullient guidance about future business prospects was offered has been particualrly vulnerable. Some of the biggest losses were among stocks priced for the strongest growth.
There is some good news for the resources sector. Its already dramatic re-pricing has meant that even the onset of relatively pessimistic views about growth have not required a significant change in market values. The sector is now on a more level playing field with other parts of the market in terms of perceived risks.
 Last
week’s equity market weakness benefited the gold sector. Gold bullion prices
have risen 5% since the beginning of the month with beneficial effects for
the equities of the gold producers. The Market Vectors junior gold miners
ETF rose 14% during the week. The S&P/ASX All Ordinaries gold index appears
poised to rise further when markets reopen on Monday.
Last
week’s equity market weakness benefited the gold sector. Gold bullion prices
have risen 5% since the beginning of the month with beneficial effects for
the equities of the gold producers. The Market Vectors junior gold miners
ETF rose 14% during the week. The S&P/ASX All Ordinaries gold index appears
poised to rise further when markets reopen on Monday.
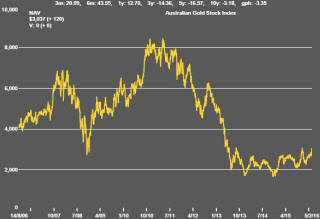
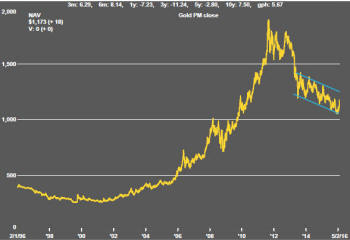
While the rise in the gold price to its highest level since October will have been welcomed by miners, the accompanying long-term chart highlights that this apparently large move has occurred within the context of a continuing downtrend in the gold price dating from late 2012.
A far more dramatic change in conditions will be needed for the directional outcome to differ. The gold market has faced some difficulty making such large upward moves when they have been against the trend of broader financial market prices. In other words, the gold price performs better when wealth is being created than when it is being destroyed.
US Manufacturing Shows the Pressure
The manufacturing conditions index produced by the U.S. Institute of Supply
Management passed through the critical “50” level in October and has
remained in the sub-50 range for four consecutive months.
This near term indicator of activity has been affected adversely by the stronger U.S. dollar which has contributed to a loss of manufacturing competitiveness.
There is a lengthy history of US ISM data going as far back as 1948 to help assess its connection with broader macro and market conditions. The chart shows swings in the ISM index and corresponding movements in the S&P 500 share price index over the past six decades.
The most recent downward reach in the share market index is historically consistent with the direction of the ISM index. Further market weakness could be anticipated based on the recent momentum of the ISM measure.
The new orders subcomponent of the ISM survey results offered some slight relief. It turned positive for the first time in three months after having moved lower through 2015. Data for a single month will be insufficient to permit any conclusion about a possible change in direction but this indicator warrants watching over the coming month as a sign that US manufacturers were extricating themselves from the negative exchange rate effects impacting their businesses.
Occidental Petroleum Shows Why Oil Market
Adjustment is Hard
The Occidental Petroleum Corporation December quarter earnings briefing
highlighted one reason why re-balancing the oil market is proving so
difficult.
Cost containment was the pervading theme among the executives briefing analysts. They exemplified the instinctive corporate reaction when commodity prices fall: survive by doing whatever it takes to keep business costs below the price barrier. If output adjustment is necessary, hopefully the burden will fall on someone else.
Occidental oil production increased by 15% in 2015. Overall production rose 14% and unit production costs declined 14%. The Occidental chief operating officer put its total cash costs at $13-14/bbl. Noncash accounting items add another $10.
More cost reductions in response to market conditions are in the wings, according to the company. Only when prices continue to push down on a lowered cost platform sometime in the year ahead, perhaps, will attention turn to reorganising the business in a way that may impact output negatively.
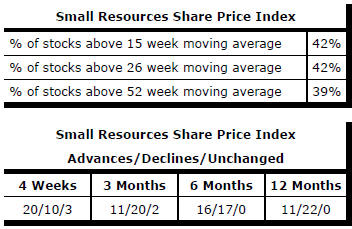
Market Breadth Statistics