The Current View
Growth in demand for raw materials peaked in late 2010. Since then, supply growth has continued to outstrip demand leading to inventory rebuilding or spare production capacity. With the risk of shortages greatly reduced, prices have lost their risk premia and are tending toward marginal production costs to rebalance markets.
To move to the next phase of the cycle, an acceleration in global output growth will be required to boost raw material demand by enough to stabilise metal inventories or utilise excess capacity.
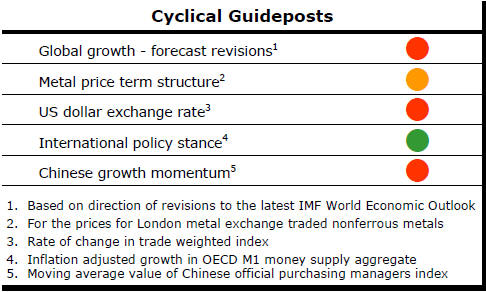
The PortfolioDirect cyclical
guideposts suggest that the best possible macroeconomic circumstances for
the resources sector will involve a sequence of upward revisions to
global growth forecasts, the term structure of metal prices once again
reflecting rising near term shortages, a weakening US dollar, strong money
supply growth rates and positive Chinese growth momentum. Only one of
the five guideposts is "set to green" suggesting the sector remains confined
to the bottom of the cycle .
Has Anything Changed? - Updated View
Since mid 2014, the metal market cyclical position has been characterised as ‘Trough Entry’ as prices have remained in downtrend with all but one of the PortfolioDirect cyclical guideposts - the international policy stance - flashing ‘red’ to indicate the absence of support.
The absence of a global growth acceleration, a stronger dollar and flagging Chinese growth momentum remain critical features of the current cyclical positioning.
Through February 2016, the first signs of cyclical improvement in nearly two years started to emerge. After 15 months of contango, the metal price term structure shifted to backwardation reflecting some moderate tightening in market conditions.
The metal price term structure is the most sensitive of the five cyclical guideposts to short term conditions and could, consequently, quickly reverse direction. Nonetheless, this is an improvement in market conditions and the guidepost indicator has been upgraded to ‘amber’ pending confirmation of further movement in this direction.
Resources Sector Outcomes Tied to Monetary
Conditions
The macro picture continues to reflect a world with insufficient output
growth momentum to support a cyclical improvement in raw material demand.
In the absence of crisis-like events, the outlook currently appears more benign than at other times but that falls significantly short of the improvement needed to sustain stronger industry conditions.
The most significantly supportive indicator among the PortfolioDirect cyclical guideposts is the policy stance of the world’s central banks. In any event, the highly accommodating monetary policies of the central banks reflect existing adverse conditions at least as much as they suggest something better in the future.
The positive liquidity effects from low interest rates and quantitative easing have had an impact on asset prices but have largely failed to support higher rates of output growth.
There is no reason to expect anything different in the near term because monetary policy operates on prices before having any impact on the real economy.
The evident weakness in growth in Europe, China and Japan arises from demographic influences and a need for structural changes over which monetary policy can exert little influence.
Similarly, in other developing market economies like India, Brazil and Russia structural impediments are a constraint on growth.
In the USA, where growth appears more robust than anywhere else, structural impediments are also evident constraints.
For the foreseeable future, three supportive elements stand out as possible contributors to a continuation of stronger resource sector equity prices: a lower US dollar exchange rate, stronger demand for higher yielding corporate bonds (in response to declining official interest rates and historically low government bond yields) and quantitative easing measures encouraging equity markets to move higher through the replenishment of liquidity. None of these three ingredients are certain.
Dollar weakness will depend on how aggressively central banks outside the USA use their currencies to pursue improvements in industry competitiveness.
The high yield corporate bond market could stall as a result of government bond yields being near their lower bounds. The possibility of defaults, particularly within the energy sector, should oil prices deteriorate are also a mitigating factor.
Broad-based equity market support for the sector is also problematic as indexes push to new records without having undervalued sectors to lead the market higher especially with the profitability of financial stocks constrained by low interest rates.
The inflation adjusted growth rate in OECD money supply (see chart 3 opposite) is moving in the 8-8.5% range which is in the vicinity of the strongest growth rates over the past 50 years.
Such growth rates in the past would have been enough to support stronger metal prices, with a lag, as the combination of inflation impetus, liquidity flows funding speculation and lagged growth effects had an impact.
Currently, liquidity flows supporting speculative activity are acting without the benefit of the other forces.
China Manufacturing Malaise
The official Chinese manufacturing purchasing managers
index for July has shown again industry being on the cusp of contraction
(see chart 4 opposite).
Government officials have been urging the adoption of structural changes including a focus on more efficient manufacturing production and less wasteful use of physical resources. While Chinese progress along this path appears slow, changes are moving in the right direction with a supportive government, in contrast with what is happening elsewhere.
Nonetheless, in China’s case, the very success of its reform agenda will mean slower output growth in the near term before the country can consolidate around a more solid longer-term growth trajectory.