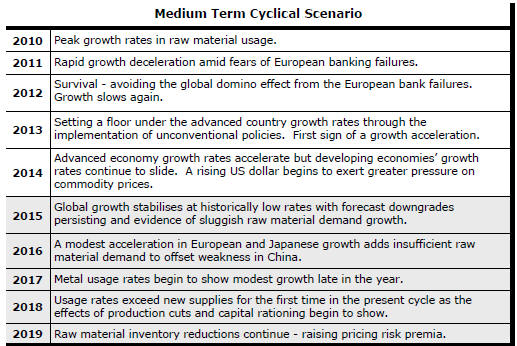
The Current View
Growth in demand for raw materials peaked in late 2010. Since then, supply growth has continued to outstrip demand leading to inventory rebuilding or spare production capacity. With the risk of shortages greatly reduced, prices have lost their risk premia and are tending toward marginal production costs to rebalance markets.
To move to the next phase of the cycle, an acceleration in global output growth will be required to boost raw material demand by enough to stabilise metal inventories or utilise excess capacity.
The PortfolioDirect cyclical
guideposts suggest that the best possible macroeconomic circumstances for
the resources sector will involve a sequence of upward revisions to
global growth forecasts, the term structure of metal prices once again
reflecting rising near term shortages, a weakening US dollar, strong money
supply growth rates and positive Chinese growth momentum. Only one of
the five guideposts is "set to green" suggesting the sector remains confined
to the bottom of the cycle .

Has Anything Changed? - Updated View
Since mid 2014, the metal market cyclical position has been characterised as ‘Trough Entry’ as prices have remained in downtrend with all but one of the PortfolioDirect cyclical guideposts - the international policy stance - flashing ‘red’ to indicate the absence of support.
The absence of a global growth acceleration, a stronger dollar and flagging Chinese growth momentum remain critical features of the current cyclical positioning.
Through February 2016, the first signs of cyclical improvement in nearly two years started to emerge. After 15 months of contango, the metal price term structure shifted to backwardation reflecting some moderate tightening in market conditions.
The metal price term structure is the most sensitive of the five cyclical guideposts to short term conditions and could, consequently, quickly reverse direction. Nonetheless, this is an improvement in market conditions and the guidepost indicator has been upgraded to ‘amber’ pending confirmation of further movement in this direction.
Exchange Rate Impact
Changes in the direction of metal prices over the past 35 years (illustrated
in the chart opposite by the International Monetary Fund metal price index)
have typically coincided with
 changes
in the direction of the U.S. dollar exchange rate (shown in the chart as of
the trade weighted index for the country’s major trading partners).
Without a contribution from global GDP growth toward a re-balancing of physical commodity inventories, further price rises are likely to depend on ongoing declines in the exchange rate.
The apparent reversal in the direction of the exchange rate reflects changed views about movements in official U.S. interest rates but it remains hard to foresee the balance of monetary policies indefinitely favouring the appreciating yen or Euro implied by dollar weakness.
US Labour Market Improvement
Weekly jobless claims numbers for the USA, illustrated in the chart on the
reversed scale and showing the connection with stock prices, have continued
to fall. An ongoing decline through these historically low levels is
becoming progressively harder to foresee. Nonetheless, the statisics do
show ongoing improvement in US labour market conditions.
Such a trajectory would normally suggest employer
optimism
 but,
against the backdrop of slowing output growth, seems more consistent with
presently declining productivity and profit pressures. In a two paced
economy, strengthening consumer demand is occurring in parallel with a
recession in business conditions.
The labour market improvement is consistent with an expanding economy but the rate of improvement will subside eventually to something more sustainable leaving the pace of output growth potentially slower than it has been.
Some economists had seen a contradiction between the pace of U.S. labour market improvement and the seemingly slower pace of output growth raising the possibility that the less reliable growth data was under reporting activity.
The most recent labor market data intimate something in the middle of these two possibilities with a softening in labour market conditions reflecting the slower pace of output growth but falling short of a complete retracement.
Chinese Manufacturing Expansion
The official Chinese manufacturing purchasing managers index for April
showed a slight fall from a month earlier and a reading only slightly above
50 indicating the most moderate of output expansions.

Chart 4 in the right hand panel shows a longer term relationship between the expansion in Chinese manufacturing output and Australian resources sector equity prices.
Looked at in this way, the most recent performance of the Chinese manufacturing sector is hard to discern. The chart immediately opposite shows the same data over a shorter term. It more effectively highlights how equity prices have remained connected to changes in the momentum of Chinese manufacturing activity.


