The Current View
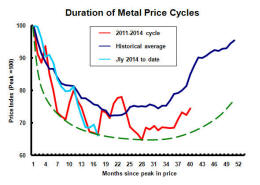
Growth in demand for raw materials peaked in late 2010. Since then, supply growth has continued to outstrip demand leading to inventory rebuilding or spare production capacity. With the risk of shortages greatly reduced, prices have lost their risk premia and are tending toward marginal production costs to rebalance markets.
To move to the next phase of the cycle, an acceleration in global output growth will be required to boost raw material demand by enough to stabilise metal inventories or utilise excess capacity.
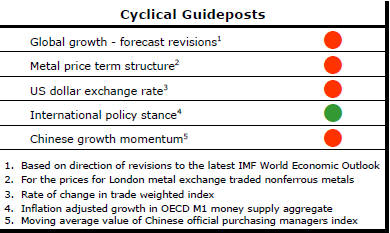
The PortfolioDirect cyclical
guideposts suggest that the best possible macroeconomic circumstances for
the resources sector will involve a sequence of upward revisions to
global growth forecasts, the term structure of metal prices once again
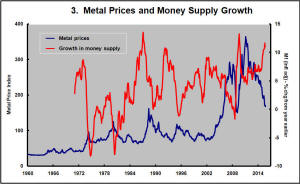
reflecting rising near term shortages, a weakening US dollar, strong money
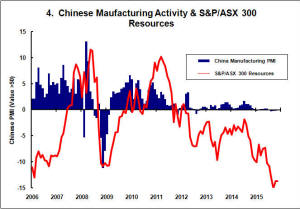
supply growth rates and positive Chinese growth momentum. Only one of
the five guideposts is "set to green" suggesting the sector remains confined
to the bottom of the cycle .
Has Anything Changed?
Throughout 2014, PortfolioDirect had been characterising the cyclical position as ’Trough Entry’ with some expectation that by the end of 2014 an exit would be evident. Until very late in the year, the evidence supported that possibility before conditions took several backward steps.
The absence of a growth acceleration among the major economic regions is contributing to the flagging momentum. A stronger US dollar is also imparting a downward bias to US dollar denominated prices presently.
This change has been enough to define a fresh cycle and a more prolonged adjustment process.
Cycle Heads Lower Again
The cyclical positioning of the metal markets deteriorated again during the
week. Although U.S. employment data for October was better than expected,
the impact on the U.S. dollar of stronger growth expectations and rising
interest rates had a negative effect on the major nonferrous metal prices,
gold and crude oil.
Copper Demand Macro Modelling
The PortfolioDirect macro framework treats metal usage as a function of
global growth patterns. In particular, it models metal usage as a function
of the rate of global GDP growth and its momentum (i.e. whether the growth
rate is rising or falling).
Using copper as an example of the connection between usage rates and global growth, the chart shows annual changes in the actual rates of metal demand (in the blue line) and the rates of growth implied by the PortfolioDirect copper consumption forecasting model (in the red line). The data for the years between 1960 and 2015 are drawn from industry sources, the International Copper Study Group (ICSG) and the International Monetary Fund (IMF).
The strong connection evident between consumption growth and the pattern of global growth over such a prolonged period points to the absence of any newly introduced factor during this spread of over 50 years which might have disrupted the relationship.
One of the most prolonged periods of divergence between the model results and actual outcomes has been during 2013-14 when reported copper consumption appears to have been unusually strong.
According to the ICSG, copper metal usage in 2014 was 7.0% higher than in 2013 despite little difference in growth rates between 2014 and 2013 and growth in both years being lower than in any of the prior three years.
The 2014 industry estimate of metal consumption may yet be adjusted to bring it more into line with historical outcomes. The annual consumption estimates are subject to sometimes significant revisions with the model output pointing to this possibility given the unusually large divergence between the current 2014 estimate and what would have been a more normal response to similar macro outcomes in the past.
In any case, consumption in 2015 appears to be compensating to some extent. According to the latest ICSG data, copper metal usage was 1.9% lower in the seven months to July 2015 than in the corresponding period of 2014 raising the probability of a decline in consumption for 2015 as a whole.
Based on the global growth forecasts from the IMF published in October 2015, the consumption growth rate implied by the PortfolioDirect model would be 1.6% and 1.1% in 2015 and 2016, respectively. The ICSG has forecast a 1.2% contraction in 2015 consumption and 3% growth in 2016.
Matched with the industry body’s latest estimate of production in 2015 and 2016 published in October 2015, the PortfolioDirect demand forecasts imply inventories finishing 2015 slightly higher but very close to where they sat at the end of 2014.
Significantly, the demand modelling using the IMF latest growth projections for 2016-2019 suggests consumption growth rates below the rate of potential metal output. The resulting build-up in inventories would be consistent with a prolonged period of sustained downward pressure on copper prices (although price forecasts will also have to take account of exchange rate and interest rate movements which typically also impact prices and which will be discussed further in a future PortfolioDirect commentary). .