The Current View
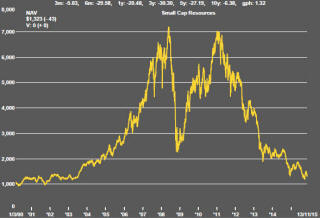
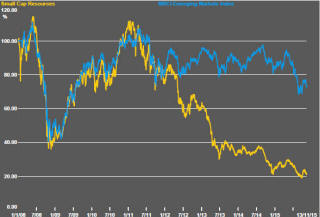
A lengthy downtrend in sector prices had given way to a relatively stable trajectory after mid 2013 similar to that experienced in the latter part of the 1990s and first few years of the 2000s.
The late 1990s and early 2000s was a period of macroeconomic upheaval during which time sector pricing nonetheless proved relatively stable. That remains a possible scenario for sector prices.
Relative stability suggests a chance for companies genuinely adding value through development success to see their share prices move higher. This was the experience in the late 1990s and early 2000s.
The lower equity prices fall - and the higher the cost of capital faced by development companies - the harder it becomes to justify project investments. The market is now entering a period prone to even greater disappointment about project delivery .
Has Anything Changed?
The assumption that June 2013 had been the cyclical trough for the market was premature.
Sector prices have adjusted to the next level of support. The parallel with the 1990s illustrated in Chart 4 is being tested. Prices will have to stabilise around current levels for several months for the thesis to hold.
Key Outcomes in the Past Week
Signs a week earlier of the U.S. equity market taking the possibility of an official interest rate rise in its stride have given way to rising nervousness about the prospect.
After the large US employment increase for October
was released on 6 November, the S&P 500 implied volatility index declined
and the S&P 500 itself rose. At the same time, bond yields and the U.S.
dollar both moved higher. There seemed little doubt among market
participants that an official interest rate rise was on the cards. The
sense of panic that had accompanied the rise of similar expectations on
earlier occasions appeared absent.
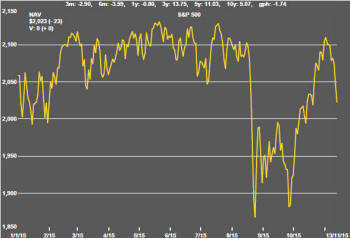
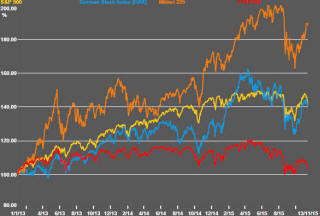
The more positive tone had enabled the S&P 500 to return rapidly to levels it had reached through the middle months of 2015. Nonetheless, there were reasons to think that the market may not have sufficient momentum to carry it beyond these previous upper limits some of which have been canvassed in recent editions of the PortfolioDirect investment report.
The continuing rise of the U.S. dollar has eroded earnings among U.S. multinationals. Companies reporting third quarter earnings have been beating expectations in much the same manner and extent to which they have typically done in the past. However, on this occasion, several high profile companies have offered up relatively pessimistic forward guidance. Several retailers and technology companies have been notably downbeat in their assessments of market prospects.
Oil Market Adjustment
Lower crude oil prices have continued to destabilise U.S. equity prices
through their impact on the corporate earnings of large integrated oil
refiners and service providers to the industry. The falling drilling rig
count illustrated in the chart remains a sign that service provider income
is under pressure.
While production is below its peak, the decline
does not reflect the extent of the fall in rig numbers. The rising
productivity of newer wells has meant that lost production from those being
turned off is more than compensated for by a fewer number of new wells
coming on stream. 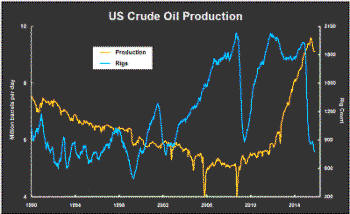
The productivity benefits will eventually run their course but the time required for this to happen is far longer than had been expected when the market turned in 2014.
Short of joint action by producing nations, a rebalancing of the market will depend primarily on growing demand soaking up inventories. Falling US rig productivity as newer wells move past peak production combined with capital rationing placing limits on how many new wells begin production will eventually have an impact on the market adjustment. Until then, the energy sector will remain a drag on US equity market conditions.
The natural resources sector as a whole remained in a price downtrend dating from early October. There was added pressure on sector indices as a result of the dam wall collapse at the Samarco iron ore mine in Brazil jointly owned by BHP Billiton and Vale. The S&P/ASX 100 resources index fell 9.1% after a 10.9% fall in the BHP Billiton share price. Australia’s small resources share price index fell 5.6%. The Euromoney Global Mining Index declined 6.0%. .
. .
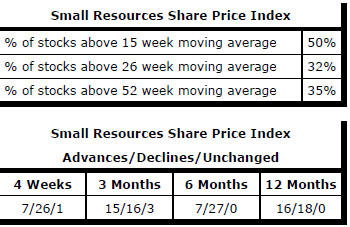
Market Breadth Statistics