The Current View
Growth in demand for raw materials peaked in late 2010. Since then, supply growth has continued to outstrip demand leading to inventory rebuilding or spare production capacity. With the risk of shortages greatly reduced, prices have lost their risk premia and are tending toward marginal production costs to rebalance markets.
To move to the next phase of the cycle, an acceleration in global output growth will be required to boost raw material demand by enough to stabilise metal inventories or utilise excess capacity.
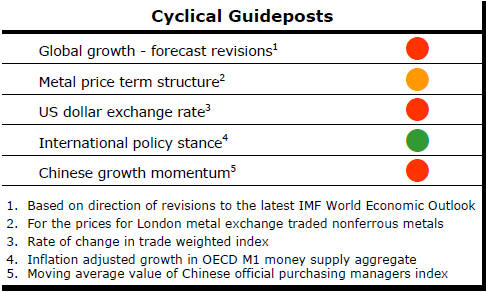
The PortfolioDirect cyclical
guideposts suggest that the best possible macroeconomic circumstances for
the resources sector will involve a sequence of upward revisions to
global growth forecasts, the term structure of metal prices once again
reflecting rising near term shortages, a weakening US dollar, strong money
supply growth rates and positive Chinese growth momentum. Only one of
the five guideposts is "set to green" suggesting the sector remains confined
to the bottom of the cycle .
Has Anything Changed? - Updated View
Since mid 2014, the metal market cyclical position has been characterised as ‘Trough Entry’ as prices have remained in downtrend with all but one of the PortfolioDirect cyclical guideposts - the international policy stance - flashing ‘red’ to indicate the absence of support.
The absence of a global growth acceleration, a stronger dollar and flagging Chinese growth momentum remain critical features of the current cyclical positioning.
Through February 2016, the first signs of cyclical improvement in nearly two years started to emerge. After 15 months of contango, the metal price term structure shifted to backwardation reflecting some moderate tightening in market conditions.
The metal price term structure is the most sensitive of the five cyclical guideposts to short term conditions and could, consequently, quickly reverse direction. Nonetheless, this is an improvement in market conditions and the guidepost indicator has been upgraded to ‘amber’ pending confirmation of further movement in this direction.
US Leading Economic Indicator Loses Momentum
The US leading economic indicator published by the Federal Reserve Bank of
Philadelphia has shown a very slight loss of momentum in the latter part of
2015 but remains consistent with modest growth outcomes of 2-3% in the
balance of 2016. 
From a resource sector standpoint, where momentum plays a vital part in driving raw material usage rates, the negative implication adds to weakening growth outcomes elsewhere.
The US cyclical position will combine with a highly likely loss of momentum in Europe after the UK vote to exit the European Union. Chinese economic adjustment continues to imply downside risks to growth. A firming yen which is hindering the export competitiveness of Japanese companies is also a drag on Japan’s near term growth prospects.
US Corporates Signal Rising Manufactured Exports
The 5% first half decline in the US dollar has helped improve the export
outlook for US manufacturers (and the sales prospects for S&P 500 companies
starting to report June quarter earnings this week).
US corporate earnings stalled through 2015 as sales
contracted and companies ran out of cost containment options. Export sales,
which can enable companies to break from the confines of a slowly growing
domestic economy, were damaged by the stronger U.S. dollar which also
subtracted from the earnings of multinationals in the S&P 500 index.
The monthly US Institute for Supply Management survey of manufacturing business conditions for June has confirmed a reversal in the trend of new export orders which the survey had shown contracting throughout 2015.
The June survey result was the strongest since September 2014. The chart showing the ISM new export orders survey outcomes (in blue) and S&P 500 sales growth (in red) since 2000 suggests a positive effect on S&P 500 sales and earnings over the balance of 2016.
Silver Adjustment has Some Way to Go
The silver price has begun to retrieve the losses against gold accumulated
over nearly five years.
There has been a five percentage point outperformance by
the silver price since the end of June and a total gain of 27% since the
beginning of June compared with the 12% rise in the gold price. 
While the extent of the outperformance has stalled somewhat in the last few days, the chart puts these near term price movements in the broader historical context of the past 35 years.
Despite the size of the recent relative price movements, the silver price remains near the upper end of the historical range in the gold/silver price ratio.
The historical pattern suggests a strong tendency to mean reversion in the ratio. The history also suggests that the price adjustment process can persist for many months once commenced and before being completed. .