The Current View
Growth in demand for raw materials peaked in late 2010. Since then, supply growth has continued to outstrip demand leading to inventory rebuilding or spare production capacity. With the risk of shortages greatly reduced, prices have lost their risk premia and are tending toward marginal production costs to rebalance markets.
To move to the next phase of the cycle, an acceleration in global output growth will be required to boost raw material demand by enough to stabilise metal inventories or utilise excess capacity.
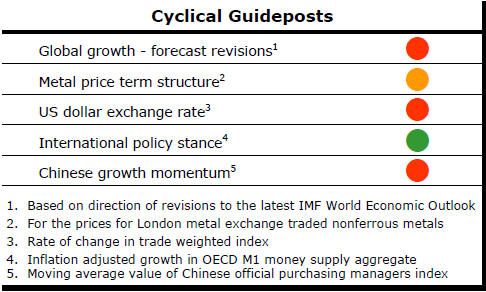
The PortfolioDirect cyclical
guideposts suggest that the best possible macroeconomic circumstances for
the resources sector will involve a sequence of upward revisions to
global growth forecasts, the term structure of metal prices once again
reflecting rising near term shortages, a weakening US dollar, strong money
supply growth rates and positive Chinese growth momentum. Only one of
the five guideposts is "set to green" suggesting the sector remains confined
to the bottom of the cycle .
Has Anything Changed? - Updated View
Since mid 2014, the metal market cyclical position has been characterised as ‘Trough Entry’ as prices have remained in downtrend with all but one of the PortfolioDirect cyclical guideposts - the international policy stance - flashing ‘red’ to indicate the absence of support.
The absence of a global growth acceleration, a stronger dollar and flagging Chinese growth momentum remain critical features of the current cyclical positioning.
Through February 2016, the first signs of cyclical improvement in nearly two years started to emerge. After 15 months of contango, the metal price term structure shifted to backwardation reflecting some moderate tightening in market conditions.
The metal price term structure is the most sensitive of the five cyclical guideposts to short term conditions and could, consequently, quickly reverse direction. Nonetheless, this is an improvement in market conditions and the guidepost indicator has been upgraded to ‘amber’ pending confirmation of further movement in this direction.
Cyclical Position Impacts Investment Style
Without a transformational shift in cyclical conditions to lift investment
returns, mining portfolio investors need more subtle money making
strategies.
Mining sector investment returns, which moved sharply positive in the earlier months of 2016, have appeared to stall after closing in on the prices which had prevailed in mid-2015.
The Euromoney global mining equity price index, for example, has nearly doubled since late January 2016 but remains lower than at any time between the first quarter of 2009 and mid-2015.
Of the performance limiting factors, the most important is the absence of a global growth acceleration. While other influences, such as exchange rate fluctuations, may also affect prices, no cycles exist without variations in global growth rates.
International Monetary Fund head Christine Largarde
recently foreshadowed a further downgrade to the group’s near-term growth
forecasts in its upcoming World Economic Outlook scheduled for October.
A cyclical recovery for mining is hard to foresee without the recently experienced sequence of negative growth revisions being reversed. More buoyant expectations among forecasters, driven by better outcomes, will also contribute to more robust risk appetites among investors and traders.
A poor discovery track record, itself partly tied to burgeoning numbers of companies vying for a falling share of available funds, has lessened the appeal of the sector.
The most risk tolerant of investors on whom the mining industry has historically depended also have a widening range of securities with which to satisfy their cravings for risk.
With such limits on the infusion of enthusiastic new buyers, profit taking among existing investors responding to unusually strong short term gains has placed a cap on further positive price action.
The resulting tendency for prices to stall quickly after an initial performance burst needs to be considered in taking investment decisions about the sector. Unless an investor is prepared to wear the opportunity costs accompanying periods of limited or negative returns, the market backdrop suggests a need for shorter term investment horizons.
Recently, the macro-driven PortfolioDirect model portfolio has had the highest cash allocation since it was initiated in 2013. The high cash allocation is partly due to cyclical conditions but also a consequence of position trimming in the belief that stock prices cannot sustain rises in the absence of new sources of portfolio funds flowing into the sector.
Since May 2013, this approach would have beaten the S&P/ASX 200 resources benchmark against which the model performance is tested by 49 percentage points.
At this point in the cycle, the PortfolioDirect model remains weighted toward a core of ‘Phase III’ companies. These are companies with established long-term production bases. The model is structured to allocate more to Phase I (exploration) and Phase II (growth through project development) as the cycle progresses.
Impact Minerals and St George mining are examples of two of the more exciting exploration companies active on the Australian scene and used in the portfolio model.
St George has interests in nickel, copper and gold bearing deposits around Laverton and Leonora in Western Australia. A rapid succession of favourable drill results is suggestive of a nickel-copper system with development potential.
Impact Minerals recently reported a 48 metre thick interval of sulphide mineralisation at its Commonwealth prospect in New South Wales. A combination of recent results points to an extensive epithermal system endowed with precious metals.
St George Mining produced a 160% return in late April 2016 before giving back 70% of the improvement. Successive exploration results - none of which could be described as disappointing - have received more muted responses than the initial discovery leaving current investors who joined the rally at the end of April with a negative return.
Since November 2015, the share price of Impact Minerals has largely been confined to a 2.5-3.5 cent trading range. Success on the ground has not been enough to break the seemingly impenetrable upper end of the company’s share price barrier.
Further along the development curve, Phase II companies should attract value-oriented investors wanting to back development success.
Execution risk is the biggest drawback for Phase II company investors. Unmet production timetables and missed sales targets unnerve investors, erode credibility and leave loyal shareholders floundering for possibly years before being able to recoup earlier losses.
TSX and ASX listed Argentine lithium deposit developer Orocobre is in this Phase II category. Another is ASX-listed Whitehaven Coal with production assets and growth opportunities in New South Wales.
Excitement over lithium will carry the market only so far. Conversely, pessimism over coal can be overcome by demonstrating profitability. Eventually, valuation rules. Value is an important guidepost for an investor trying to time market entries and exits at this point in the cycle.
The Orocobre share price tripled in the first five months of 2016 but, having moved closer to realising its potential, the upward momentum has been lost despite widespread excitement about the investment prospects of lithium producers.
The Whitehaven Coal share price battled an unsympathetic market for coal equities before posting a 450% rise.
The company’s ability to operate profitably in the past year as it expanded sales and reduced costs has encouraged investors to use Whitehaven Coal as an investment proxy for a recently improving coal market.
Now, with such a rapid price improvement, the market value of Whitehaven Coal is around the PortfolioDirect assessed value of the assets and return momentum has slowed.
Whitehaven investors face the risk, in the absence of sustainably higher coal prices, of a similar price trend to that experienced by Orocobre with valuation setting an upper bound for share prices.
The share prices of the four stocks referred to above would most likely rise strongly in the event of improved cyclical conditions, presenting a different investment decision making challenge.
In the absence of that eventuality and with an ongoing shortage of new investors, closer attention needs to be paid to other market dynamics driving the price action and which typically imply shorter holding periods to maximise investment returns.


