The Current View
Growth in demand for raw materials peaked in late 2010. Since then, supply growth has generally outstripped demand leading to inventory rebuilding or spare production capacity. With the risk of shortages greatly reduced, prices lost their risk premia and have been tending toward marginal production costs to rebalance markets.
The missing ingredient for a move to the next phase of the cycle is an acceleration in global output growth which boosts raw material demand by enough to stabilise metal inventories or utilise excess capacity.
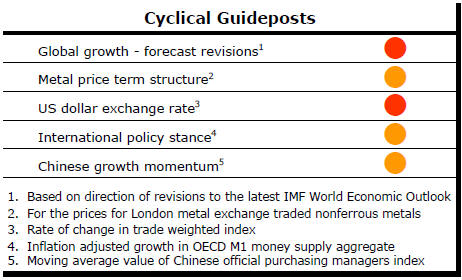
The PortfolioDirect cyclical
guideposts suggest that the best possible macroeconomic circumstances for
the resources sector will involve a sequence of upward revisions to
global growth forecasts, the term structure of metal prices once again
reflecting rising near term shortages, a weakening US dollar, strong money
supply growth rates and positive Chinese growth momentum. None of the five guideposts is "set to green"
(after the most recent adjustments in December 2016) suggesting the sector remains confined
to near the bottom of the cycle.

Has Anything Changed? - Updated View
From mid 2014, the metal market cyclical position was characterised as ‘Trough Entry’ with all but one of the PortfolioDirect cyclical guideposts - the international policy stance - flashing ‘red’ to indicate the absence of support.
Through February 2016, the first signs of cyclical improvement in nearly two years started to emerge. The metal price term structure reflected some moderate tightening in market conditions and the guidepost indicator was upgraded to ‘amber’ pending confirmation of further movement in this direction.
As of early December 2016, the Chinese growth momentum indicator was also upgraded to amber reflecting some slight improvement in the reading from the manufacturing sector purchasing managers index. Offsetting this benefit, to some extent, the policy stance indicator has been downgraded from green to amber. While monetary conditions remain broadly supportive, the momentum of growth in money supply is slackening while further constraints on fiscal, regulatory and trade regimes become evident.
Unprecedented US Labour Market Improvement
Signs of continuing U.S. labour market improvement are placing
upward pressure on inflation expectations and indirectly supporting record
equity prices.
The U.S. Department of Labor has reported that initial unemployment benefit claims had fallen to 234,000 in the week ended 4 February 2017 and had averaged 244,250 over the preceding four weeks, the lowest number of claims since the early 1970s when the employment base was half the size it is today.

While other employment indicators have also been pointing to rising demand for labour, the weekly initial claims data are are the most timely of the available indicators .
Moves in the initial claims data which have tracked movements in the U.S. equity market signal improving business conditions.
Falling claims imply a desire by employers to retain labour, a sign of business confidence. Falling claims also imply greater confidence among individuals about their employment security and, as a consequence, potentially greater willingness to spend.
The implied tigetening in the labour market should also be a precursor for stronger wages growth.
As discussed in the 6 February 2017 PortfolioDirect report, U.S. wages growth can play a disproportionately important role in the cyclical positioning of the mining industry.
China growth Momentum
Fears of a slump in Chinese economic growth which had intensified in late
2015 gave way to a gradual improvement in the momentum of growth during
2016.
Chart 4 in the right hand panel illustrates how higher readings in recent months for the official Chinese manufacturing purchasing managers index have coincided with a rebound in resource sector equity prices.
Cracks in the Chinese economic facade remain evident but, at least for the time being, officials appear to have stabilised conditions as they work on the longer term restructuring of the economy.

Chinese economic outcomes still appear to depend heavily on financial leverage. Over the 12 months ended December 2016, loans outstanding grew by 12.8%. The more volatile shorter term growth rate was 10.3% but still within the bounds of the historical performance over the preceding five years, suggesting that more financial firepower may be needed now to achieve any given output gain.

China's steel production in 2016 of 808.4 million tonnes was 0.6% higher than in 2015, according to the World Steel Association.
Chinese steel production has stabilised over the past four years leaving open the possibility of declining volumes still to come as Chinese growth becomes progressively less raw material dependent and as other countries target a rebuilding of their own industry competitiveness.

China's trade data for January was taken as a further indication that domestic conditions had stabilised and that export markets were possibly stronger than had been feared.
The U.S. dollar value of China's imports was 17% higher than 12 months earlier. Export values were 8% higher.


