The Current View
Growth in demand for raw materials peaked in late 2010. Since then, supply growth has continued to outstrip demand leading to inventory rebuilding or spare production capacity. With the risk of shortages greatly reduced, prices have lost their risk premia and are tending toward marginal production costs to rebalance markets.
To move to the next phase of the cycle, an acceleration in global output growth will be required to boost raw material demand by enough to stabilise metal inventories or utilise excess capacity.
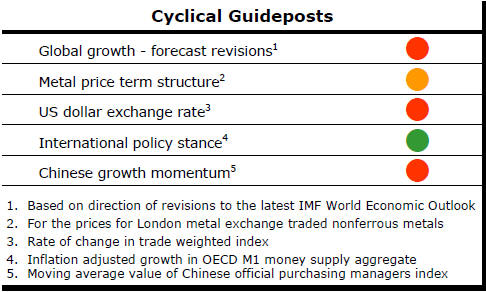
The PortfolioDirect cyclical
guideposts suggest that the best possible macroeconomic circumstances for
the resources sector will involve a sequence of upward revisions to
global growth forecasts, the term structure of metal prices once again
reflecting rising near term shortages, a weakening US dollar, strong money
supply growth rates and positive Chinese growth momentum. Only one of
the five guideposts is "set to green" suggesting the sector remains confined
to the bottom of the cycle .
Has Anything Changed? - Updated View
Since mid 2014, the metal market cyclical position has been characterised as ‘Trough Entry’ as prices have remained in downtrend with all but one of the PortfolioDirect cyclical guideposts - the international policy stance - flashing ‘red’ to indicate the absence of support.
The absence of a global growth acceleration, a stronger dollar and flagging Chinese growth momentum remain critical features of the current cyclical positioning.
Through February 2016, the first signs of cyclical improvement in nearly two years started to emerge. After 15 months of contango, the metal price term structure shifted to backwardation reflecting some moderate tightening in market conditions.
The metal price term structure is the most sensitive of the five cyclical guideposts to short term conditions and could, consequently, quickly reverse direction. Nonetheless, this is an improvement in market conditions and the guidepost indicator has been upgraded to ‘amber’ pending confirmation of further movement in this direction.
Leading Indicators Show Further Slowing
The search for global growth momentum continues ….. fruitlessly.
Global growth momentum is a critically important ingredient for a cyclical recovery in metal prices.
An improvement in global growth is normally a prerequisite for higher rates of raw material consumption. In turn, a pickup in usage rates is needed before the amount of metal used exceeds the amount being produced by enough to start soaking up supplies sitting in warehouses.
The onset of the inventory cycle signals near term price improvements.
Global growth has been subject to a succession of downward revisions over the past two years. Improvements which had been expected have not eventuated leaving modest growth rates incapable of supporting metal use near or above production rates.
Monetary policies have been set in the hope of helping
to stimulate growth but have provided little fresh impetus.
The lower interest rates fall and the more dramatic each accompanying central bank intervention becomes, the more fearful investors and consumers appear. Interest rates lowered in the hopes of spurring activity have helped inflate asset values but may have deterred growth.
At the same time, the historic fall in bond yields is leaving banks with little incentive to pursue lending for investment more aggressively.
Meanwhile, monetary policies can do nothing to help boost productivity leaving most of the advanced economies with the prospect of permanently slower potential growth in the absence of more aggressive microeconomic reform programs.
The OECD leading indicators series are designed to provide guideposts for the upcoming tempo of growth. The latest statistics from the OECD show a global economy more likely to weaken over the remainder of 2016 than show improved strength.
The first chart shows the leading indicators for the USA, Europe and Japan, the principal advanced economies.
 The
USA and Japan are evidently slowing. Europe appears able to hold its
current rate of growth but is not showing signs of doing better than the
relatively modest achievement of the past year.
The
USA and Japan are evidently slowing. Europe appears able to hold its
current rate of growth but is not showing signs of doing better than the
relatively modest achievement of the past year.
The USA and Japan seem near cyclical troughs which suggest a possible resurgence in growth later in 2016 or the early months of 2017.
The advanced economy growth indicators are summarised as the G7 in the second chart where the combined modestly weakening trend is evident. Meanwhile, China is on a stronger downswing than the industrialised countries although at approximately the same stage of decline. Only India is on the rise but with insufficient size to compensate in any significant way for the weakness elsewhere.
As commented upon in recent weekly PortfolioDirect commentaries, the leading indicator patterns also suggest that metal prices are likely to remain at the behest of exchange rates for the foreseeable future.